

After rallying over 50% since early November, bitcoin (BTC), the leading cryptocurrency by market value, looks to be carving out a pattern. If completed, this could see prices revisit the mid-$70Ks.
BTC’s price action since late November has evolved into what technical analysts call a “head and shoulders” (H&S) pattern, which foreshadows a bullish-to-bearish trend change. The first failed attempt to scale the $100,000 mark in November marked the first shoulder.
That was followed by the head, marking a swift retreat to $92,000 from the record high of over $108,000 in the second half of December. Meanwhile, the 5% drop to nearly $97,000 hints at the formation of a right shoulder.
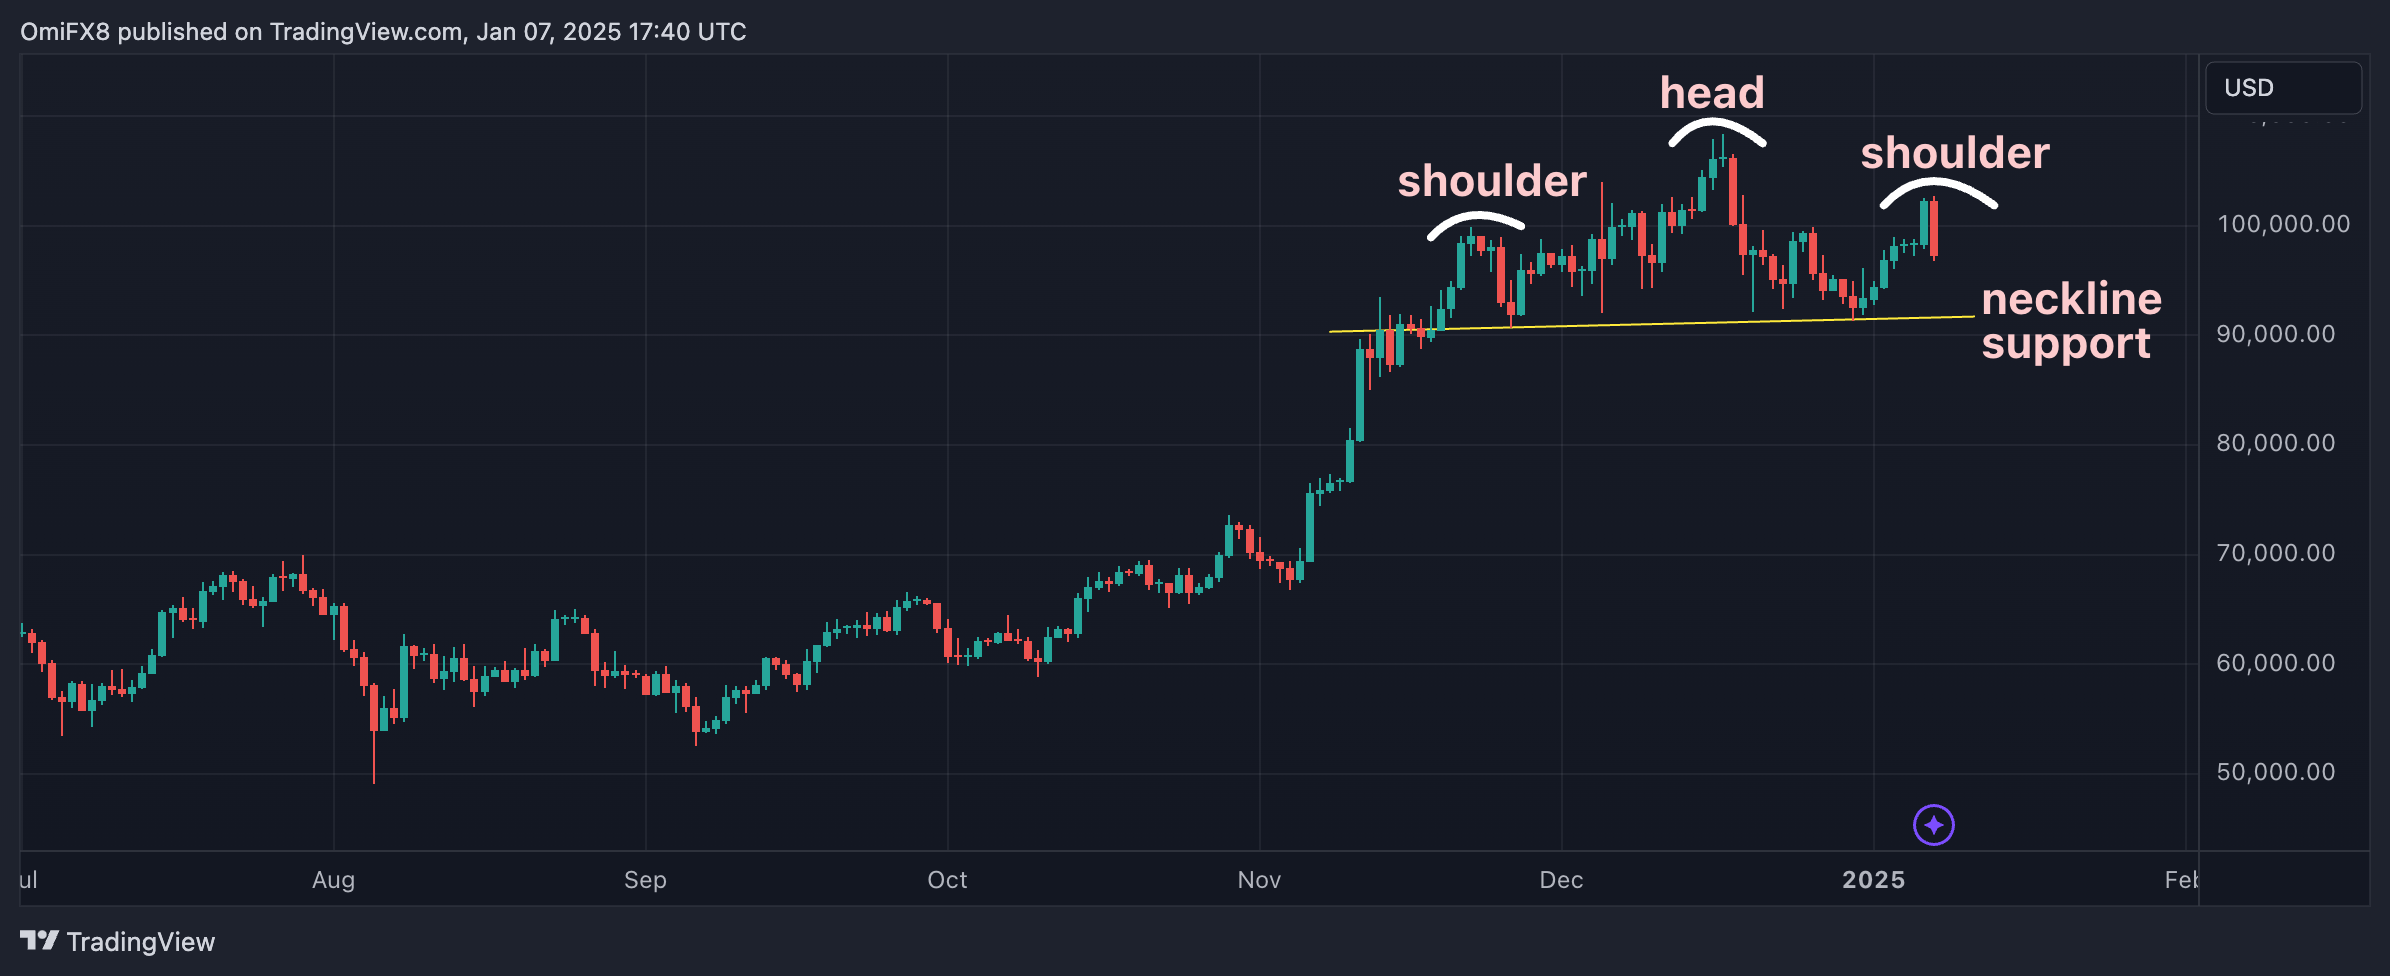
If the sell-off persists and prices fall below the neckline – the horizontal trendline connecting the troughs of the two shoulders – the bearish head-and-shoulders reversal pattern would be confirmed. As of writing, the so-called neckline support was seen around $91,500.
A break below this level could pave the way for a dip to roughly $75,000, with this figure determined using the measured move method. The method measures the vertical distance from the highest point of the head to the neckline and then subtracts the same from the neckline price point to arrive at a potential downside target.
In technical analysis, traders examine charts for price patterns to predict future price movements. However, caution is warranted while trading such patterns as these can fail, trapping traders on the wrong side of the market.