

Last week, prices for BlackRock’s spot bitcoin (BTC) exchange-traded fund (ETF) declined over 11%, with volumes reaching the highest since mid-November, according to data source TradingView.
Over 331 million shares of the ETF, which trades under the IBIT ticker on Nasdaq, changed hands as the fund’s price dipped below the January support of $50.69, eventually sliding to $46.07, the lowest since early November.
That might be a disappointment development for the bulls. For decades, one of the cardinal rules in the market has been that price movements must be validated by trading volume. It means that a bearish price action is considered to have legs when accompanied by a notable increase in the number of shares or contracts traded on the exchange.
Additionally, data from Farside Investors show investors pulled out more than $1 billion from the ETF as the price slide and the dwindling CME futures basis, representing the return on carry trades, led to panic selling. Other ten U.S.-listed ETFs bled money as well.
Still, IBIT remains the largest ETF in the world, with $39.6 billion in assets under management.
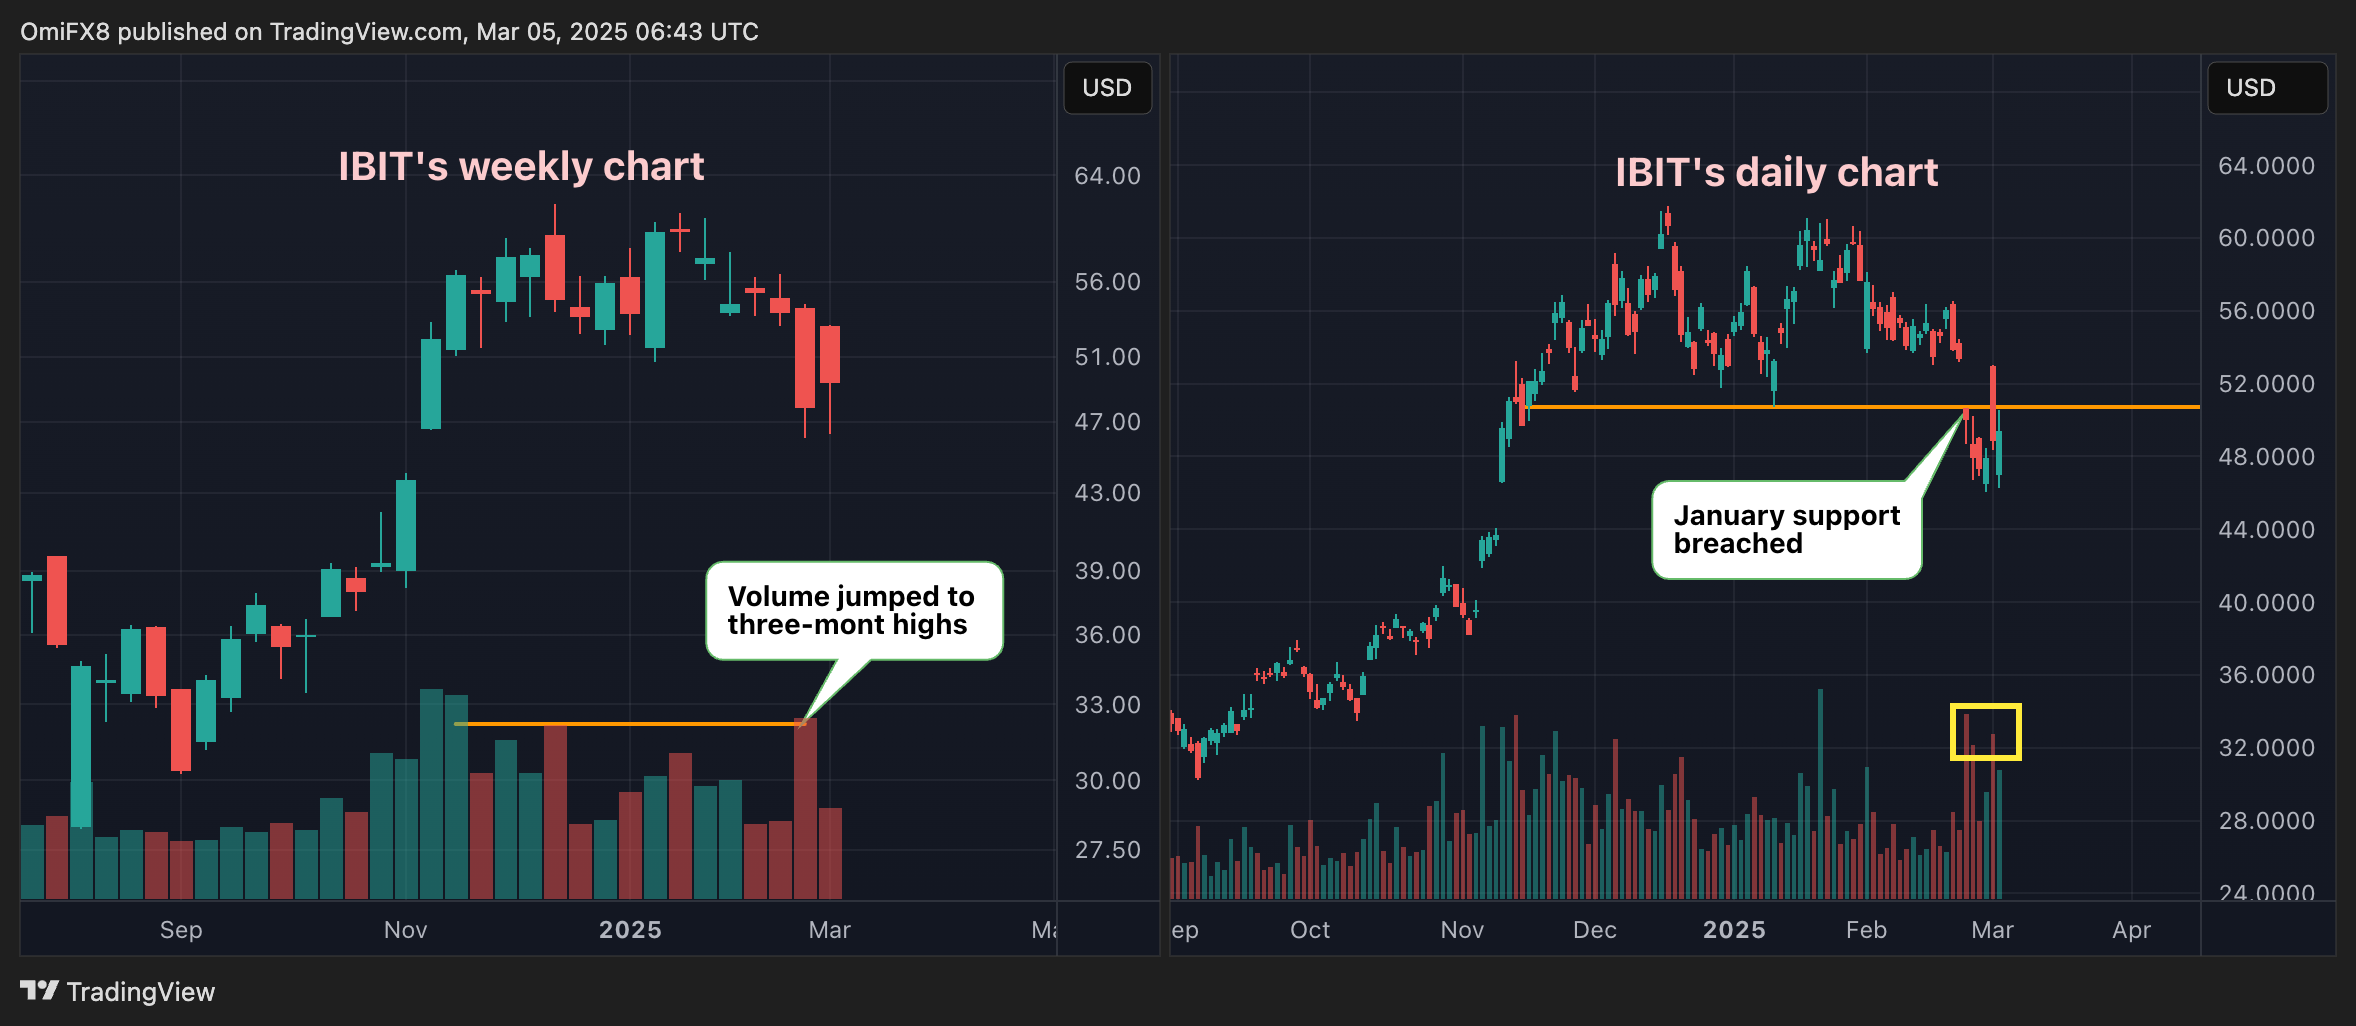
Trading volume picked up last Tuesday as IBIT broke below the horizontal support at $50.69 to signal more losses ahead.
The technical outlook remains bearish while prices hold below the former support-turned-resistance.