This is a daily technical analysis by CoinDesk analyst and Chartered Market Technician Omkar Godbole.
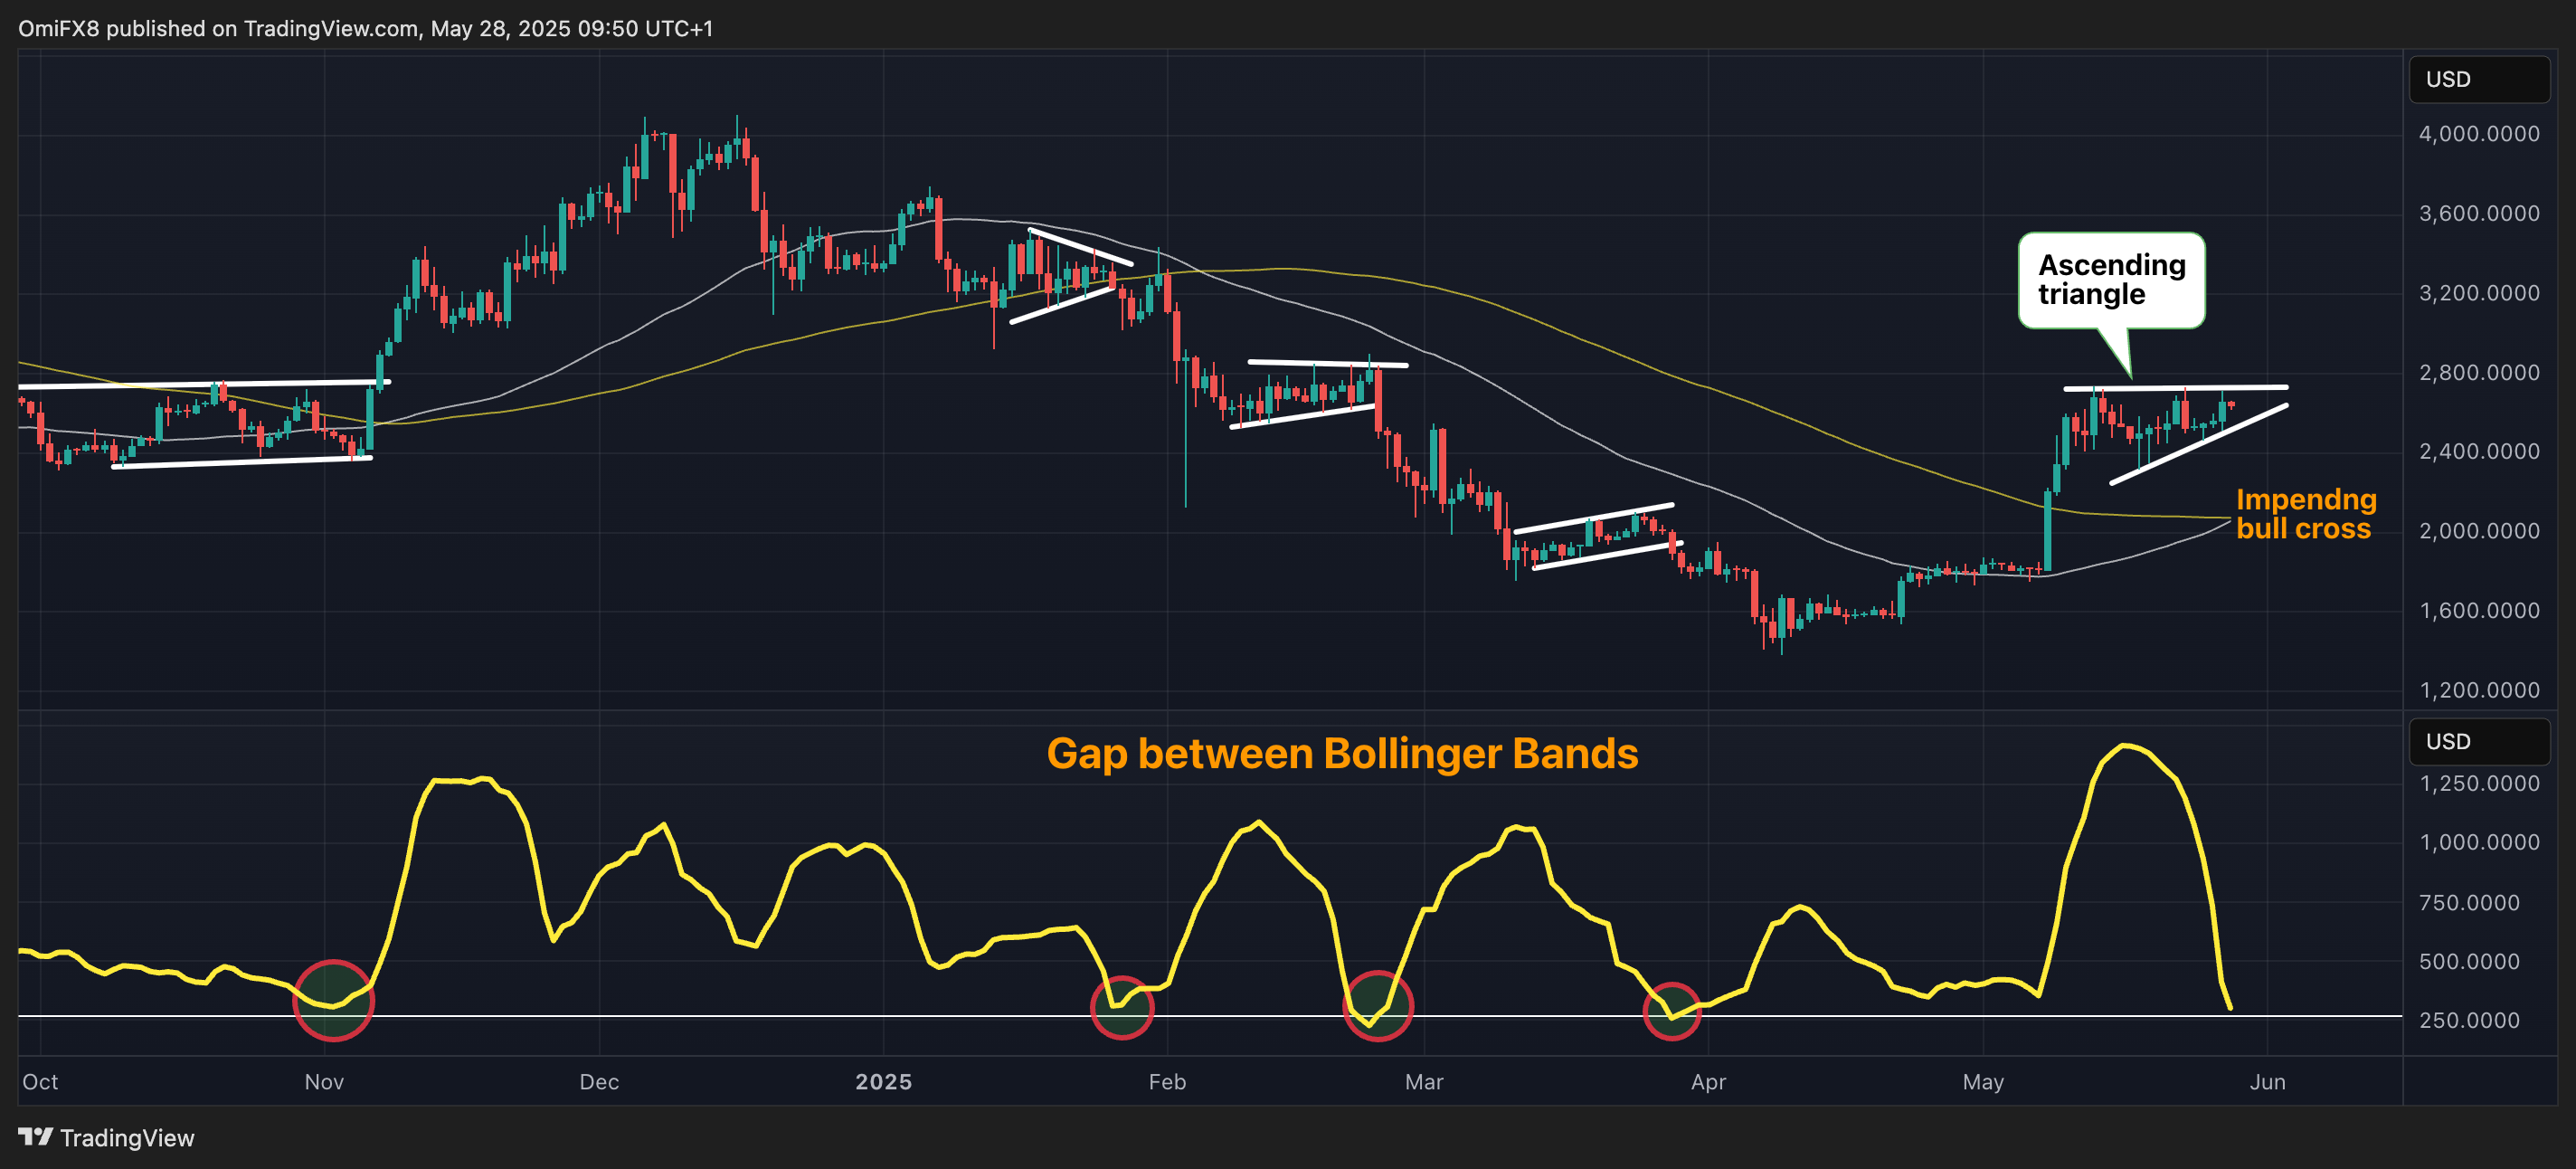
Ether ETH appears poised to surpass the $3,000 mark as it forms an “ascending triangle” pattern on the price chart.
The ascending triangle is characterized by horizontal upper-bound resistance or supply point that repeatedly caps gains and an upward-sloping support line.
Ether has faced resistance at $2,735 multiple times over the past two weeks, while subsequent reaction lows have been rising. The price action represents an ascending triangle.
The higher lows indicate that buying pressure is rising, which is what gives the ascending triangle its bullish nature. In other words, the pattern represents accumulation that usually sets the stage for the next leg of higher prices.

An expected breakout from the ascending triangle would signal a resumption of the rally from April lows near $1,390, opening the door for a move above $3,000.
The impending crossover of the 50-day simple moving average (SMA) above the 100-day SMA supports the bullish case.
The move could be explosive, as the gap between the Bollinger Bands has narrowed to nearly $250, which has consistently presaged volatility explosion since November.
Bollinger bands are volatility bands placed two standard deviations above and below the cryptocurrency’s 20-day Simple Moving Average (SMA).
“Upward breakouts occur 77% of the time, and breakouts happen roughly 61% of the distance from the base to the cradle,” Chartered Market Technician Charles Kirkpatrick wrote in his book on technical analysis.
A potential downside break of the triangular consolidation would negate the bull case and may invite stronger selling pressure.

