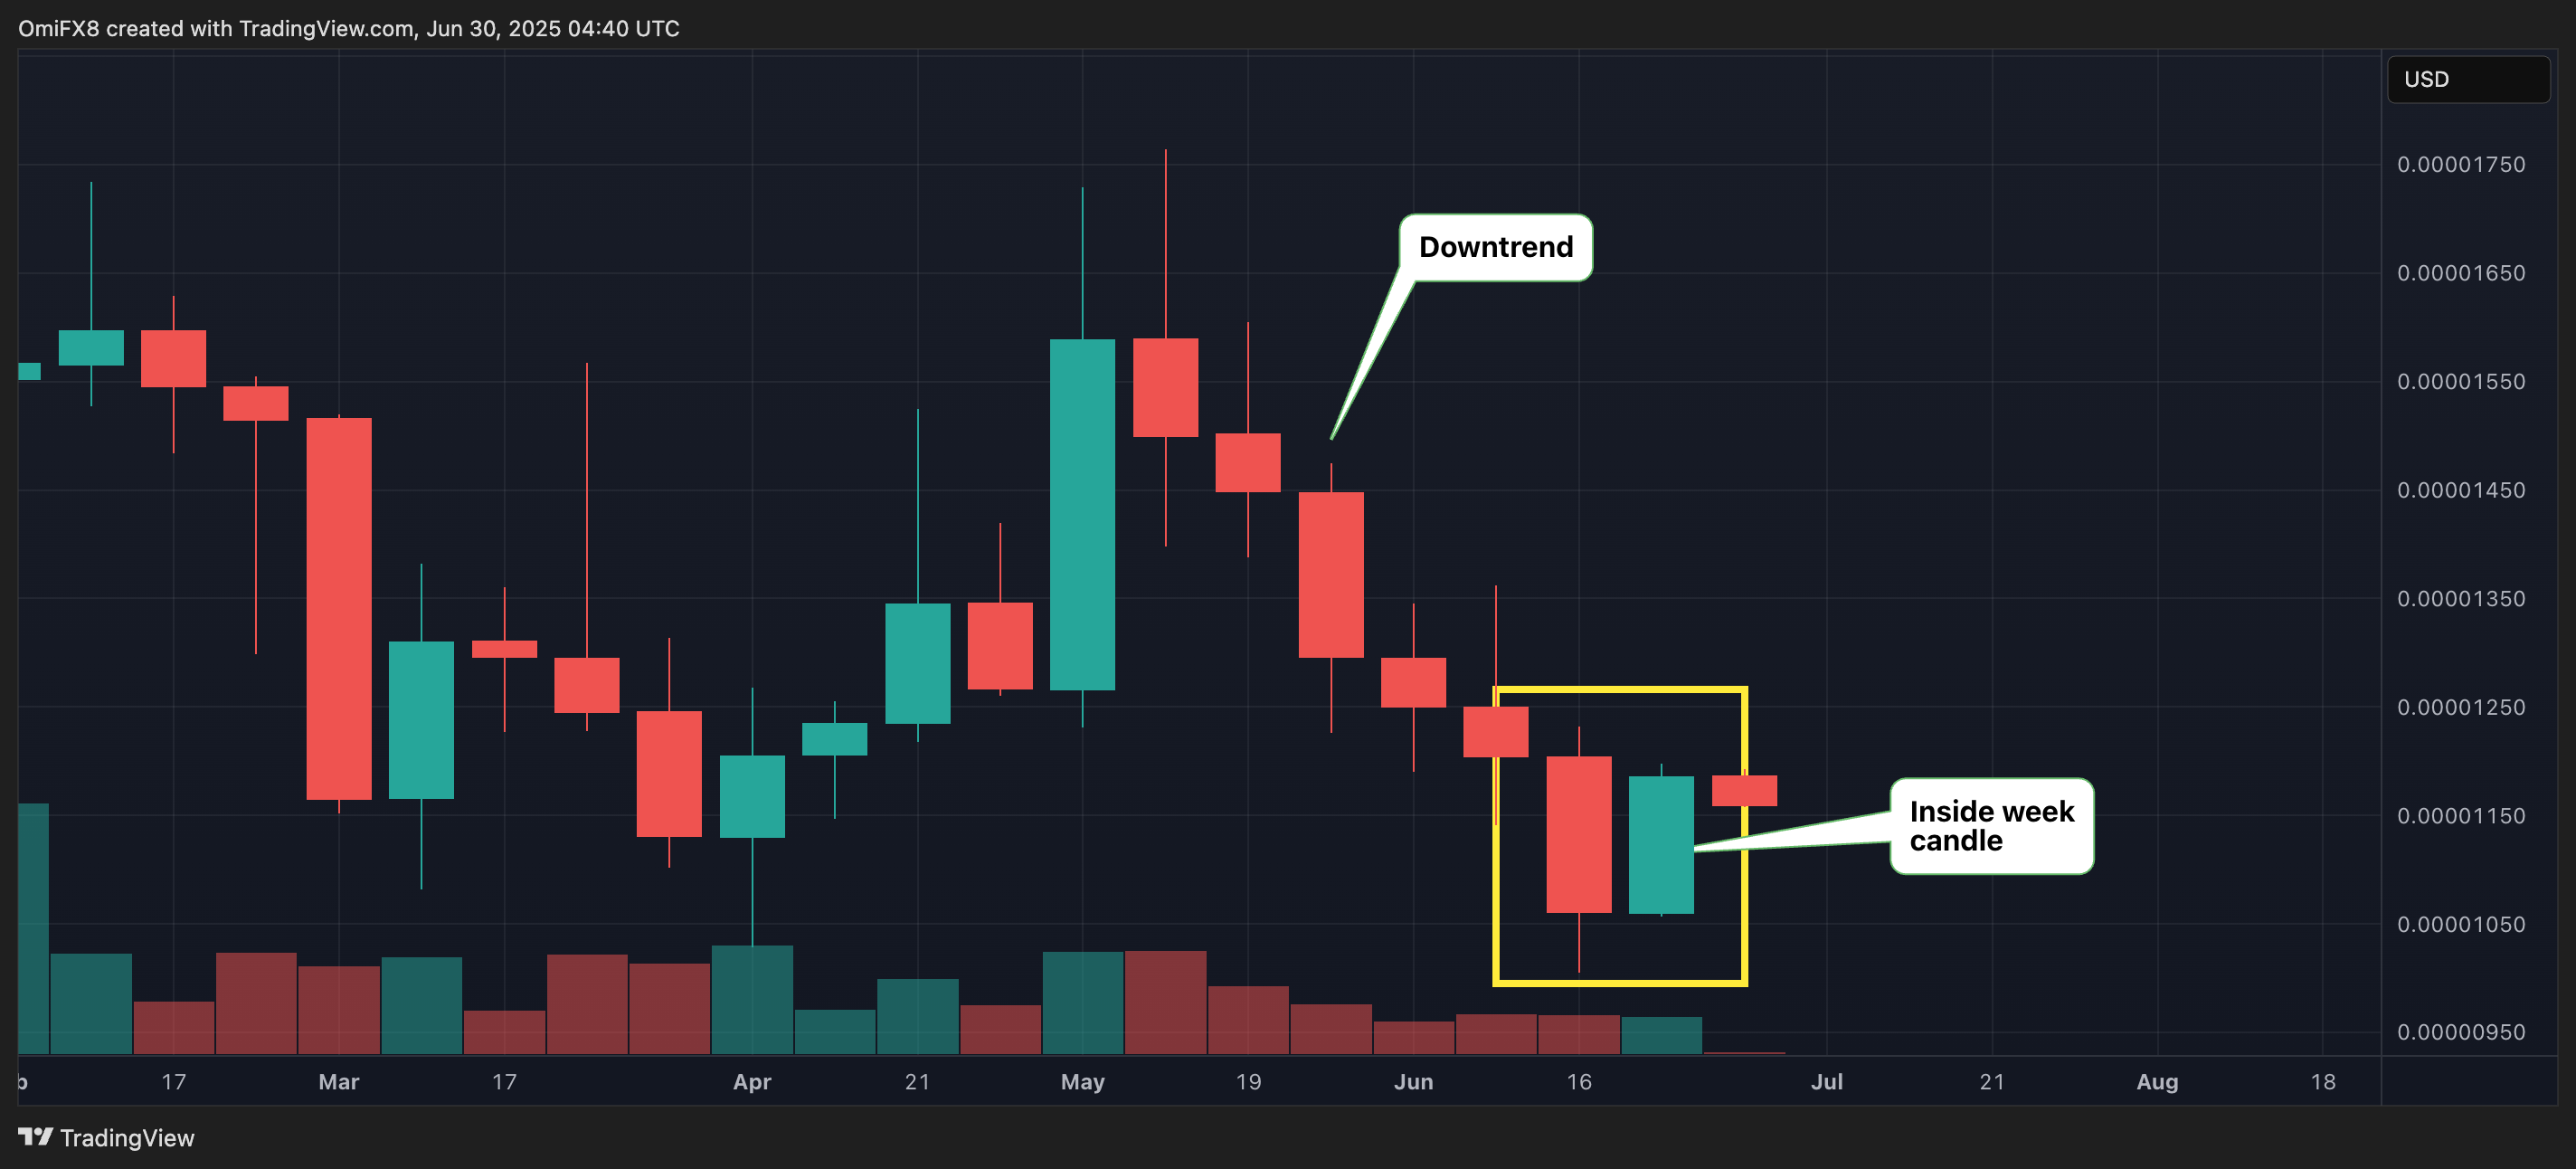
Signs of green shoots have emerged in the shiba inu SHIB market, with whale accumulation and an inside week candle suggesting a price recovery ahead.
SHIB’s price has dropped nearly 27% to $0.00001160 since mid-May, hitting a 16-month low of $0.00001005 at one point, according to data source TradingView.
The decline, however, prompted whales – investors with ample capital supply and ability to move markets – to go bargain hunting. These entities recently purchased 10.4 trillion SHIB tokens worth approximately $110 million, according to CoinDesk’s AI insights.
Meanwhile, prices bounced 11% in the seven days to June 29, forming an “insider week” candle, signaling a pause in the downtrend.
The pattern occurs when the trading range (high- low) of a weekly candle is entirely contained within the range of the preceding weekly candle. It’s a sign of indecision, with both buyers and sellers unwilling to lead the price action.
The occurrence of the said candlestick pattern after a prolonged downtrend, as in SHIB’s case, is said to represent seller exhaustion and a potential for an upward price swing.

Key points
- SHIB experienced a 4.3% price swing from $0.00001147 to $0.00001198 during the 24-hour period from 29 June 04:00 to 30 June 03:00.
- Most significant price action occurred between 21:00-22:00 on 29 June, when SHIB broke out of its consolidation pattern on 5.8x above-average volume.
- High-volume resistance established at $0.00001198, with subsequent profit-taking leading to support at the $0.00001160 level.
- 24-hour closing price of $0.00001164 represented a 1.4% gain from the opening level.
- In the last 60 minutes from 30 June 02:53 to 03:52, SHIB dropped 0.3% from $0.00001167 to $0.00001164.
- Two distinct phases marked the hourly period: an initial sharp decline to $0.00001056 between 03:17-03:28, followed by a recovery attempt peaking at $0.00001165 around 03:45.
- Volume spikes exceeding 8 million USDT occurred during key reversal points at 03:35 and 03:49, suggesting institutional positioning.

