This is a daily analysis of top tokens with CME futures by CoinDesk analyst and Chartered Market Technician Omkar Godbole.
Bitcoin: Correction risks mount
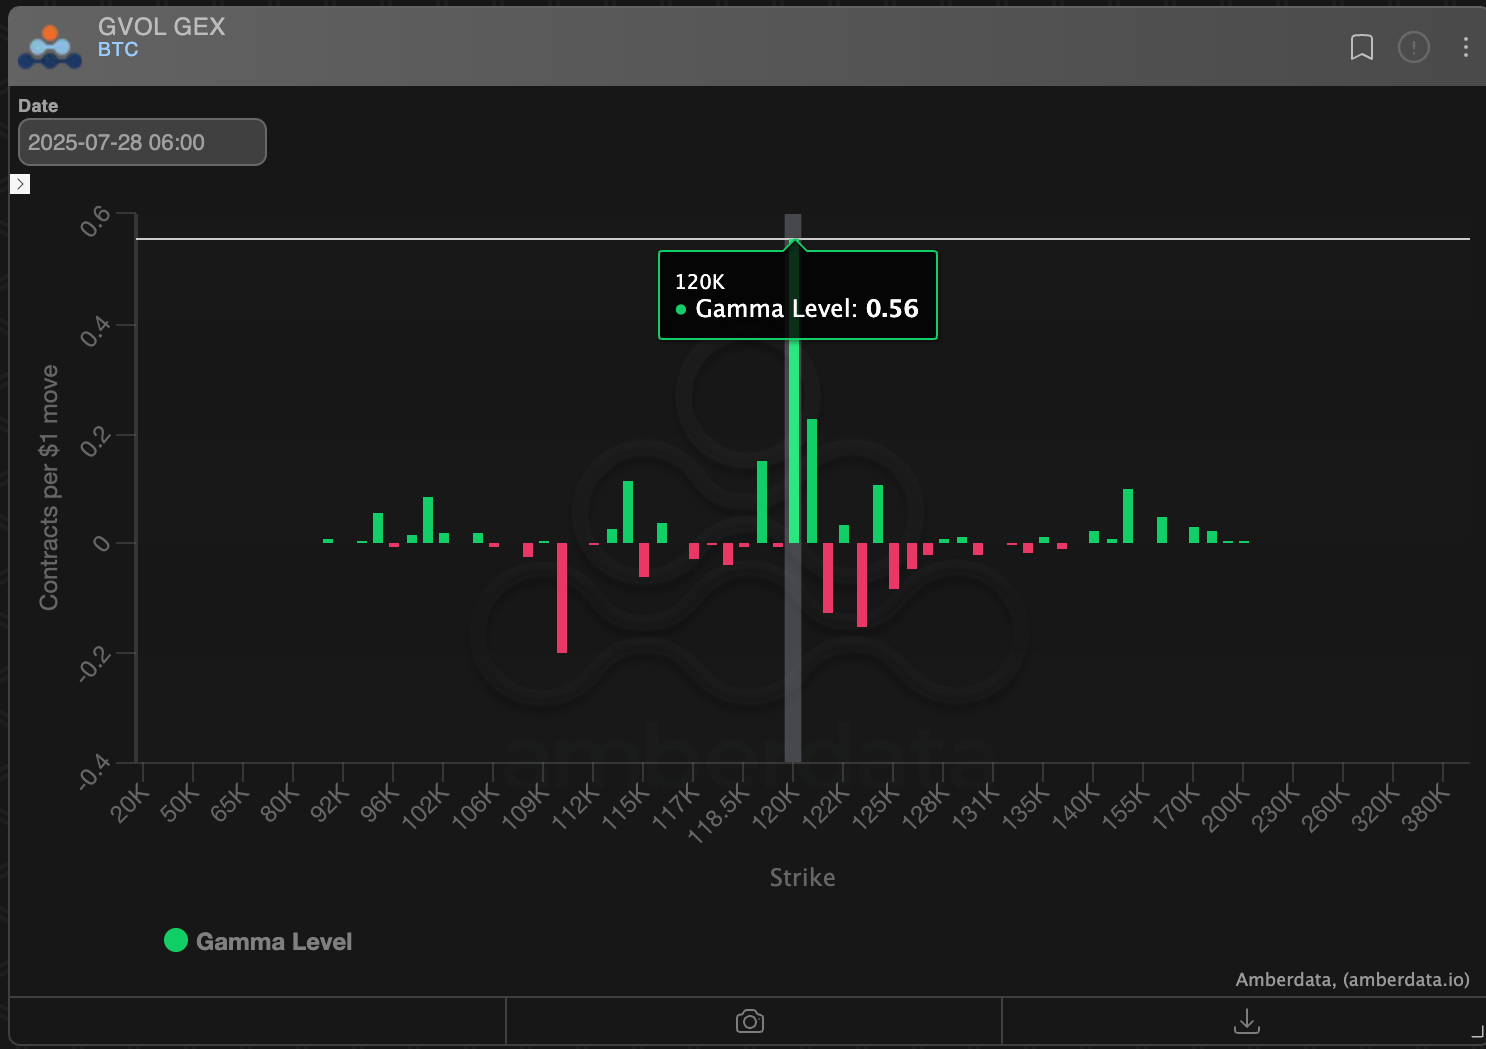
Bitcoin (BTC) continues to trade directionless near $120,000 amid data from the Deribit-listed options showing a significant positive dealer gamma at the $120,000 and $120,500 strikes. When dealers have a positive gamma exposure, they buy low and sell high to rebalance their net exposure to neutral, inadvertently arresting volatility.
The crucial support area between $116,000 and $117,000, validated by both price charts and on-chain activity, if breached, would likely pave the way for a retest of the May high just below $112,000. Conversely, a convincing move above $120,000 will likely bring record highs.
That said, the case for an extended pullback looks strong, as the miniscule 0.12% green bar, confirmed on July 22 on the three-line break chart with daily configuration, indicates uptrend exhaustion.
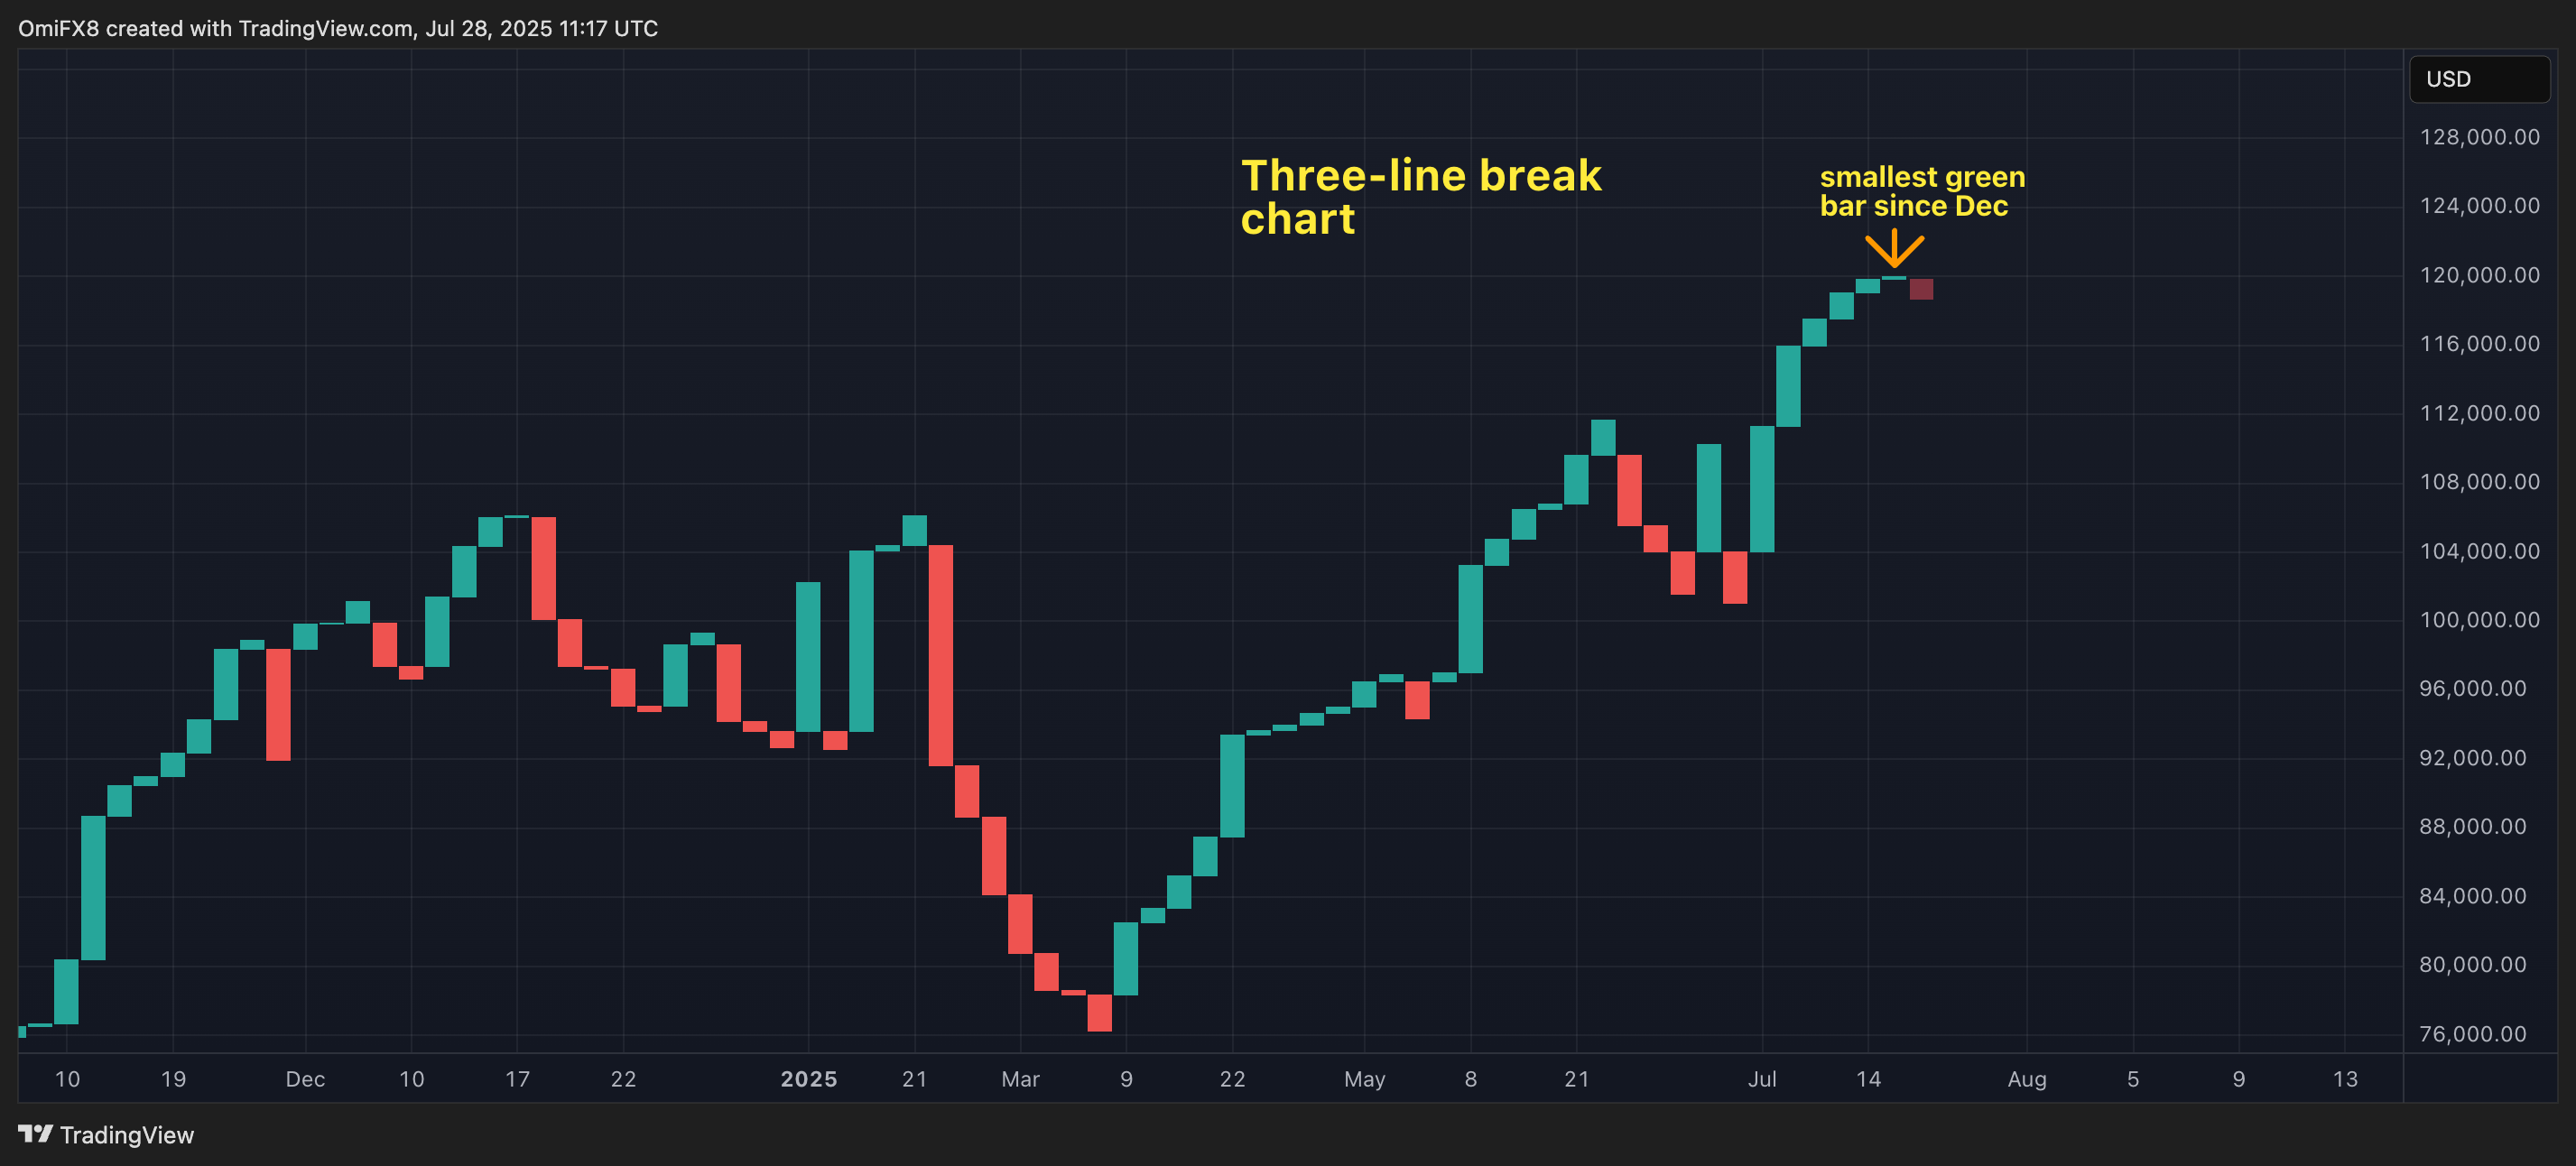
- AI’s take: On a three-line break chart, where each bar signals a confirmed trend move, the minuscule 0.12% green bar on July 22 is a significant warning. It indicates that the strong uptrend is experiencing severe exhaustion of buying momentum, suggesting a potential imminent consolidation or reversal despite the overall bullish trend.
- Resistance: $120,000, $123,181.
- Support: $116,000-$117,000, $114,700, $111,965.
Ether: Hits 7-Month
Ether (ETH) has risen nearly 2% in the past 24 hours, hitting a seven-month high of $3,937 at one point, which invalidated the indecisive Doji signal from last week.
The momentum, however, was short-lived, as prices quickly pulled back to $3,880 as of the time of writing, validating the 14-day RSI, which did not confirm the fresh multi-month high in prices, hinting at potential bearish divergence and an impending correction. The daily chart MACD histogram also teased a bearish cross, with on-chain fundamentals like Ethereum’s native fees and revenue failing to keep pace with the rising prices.
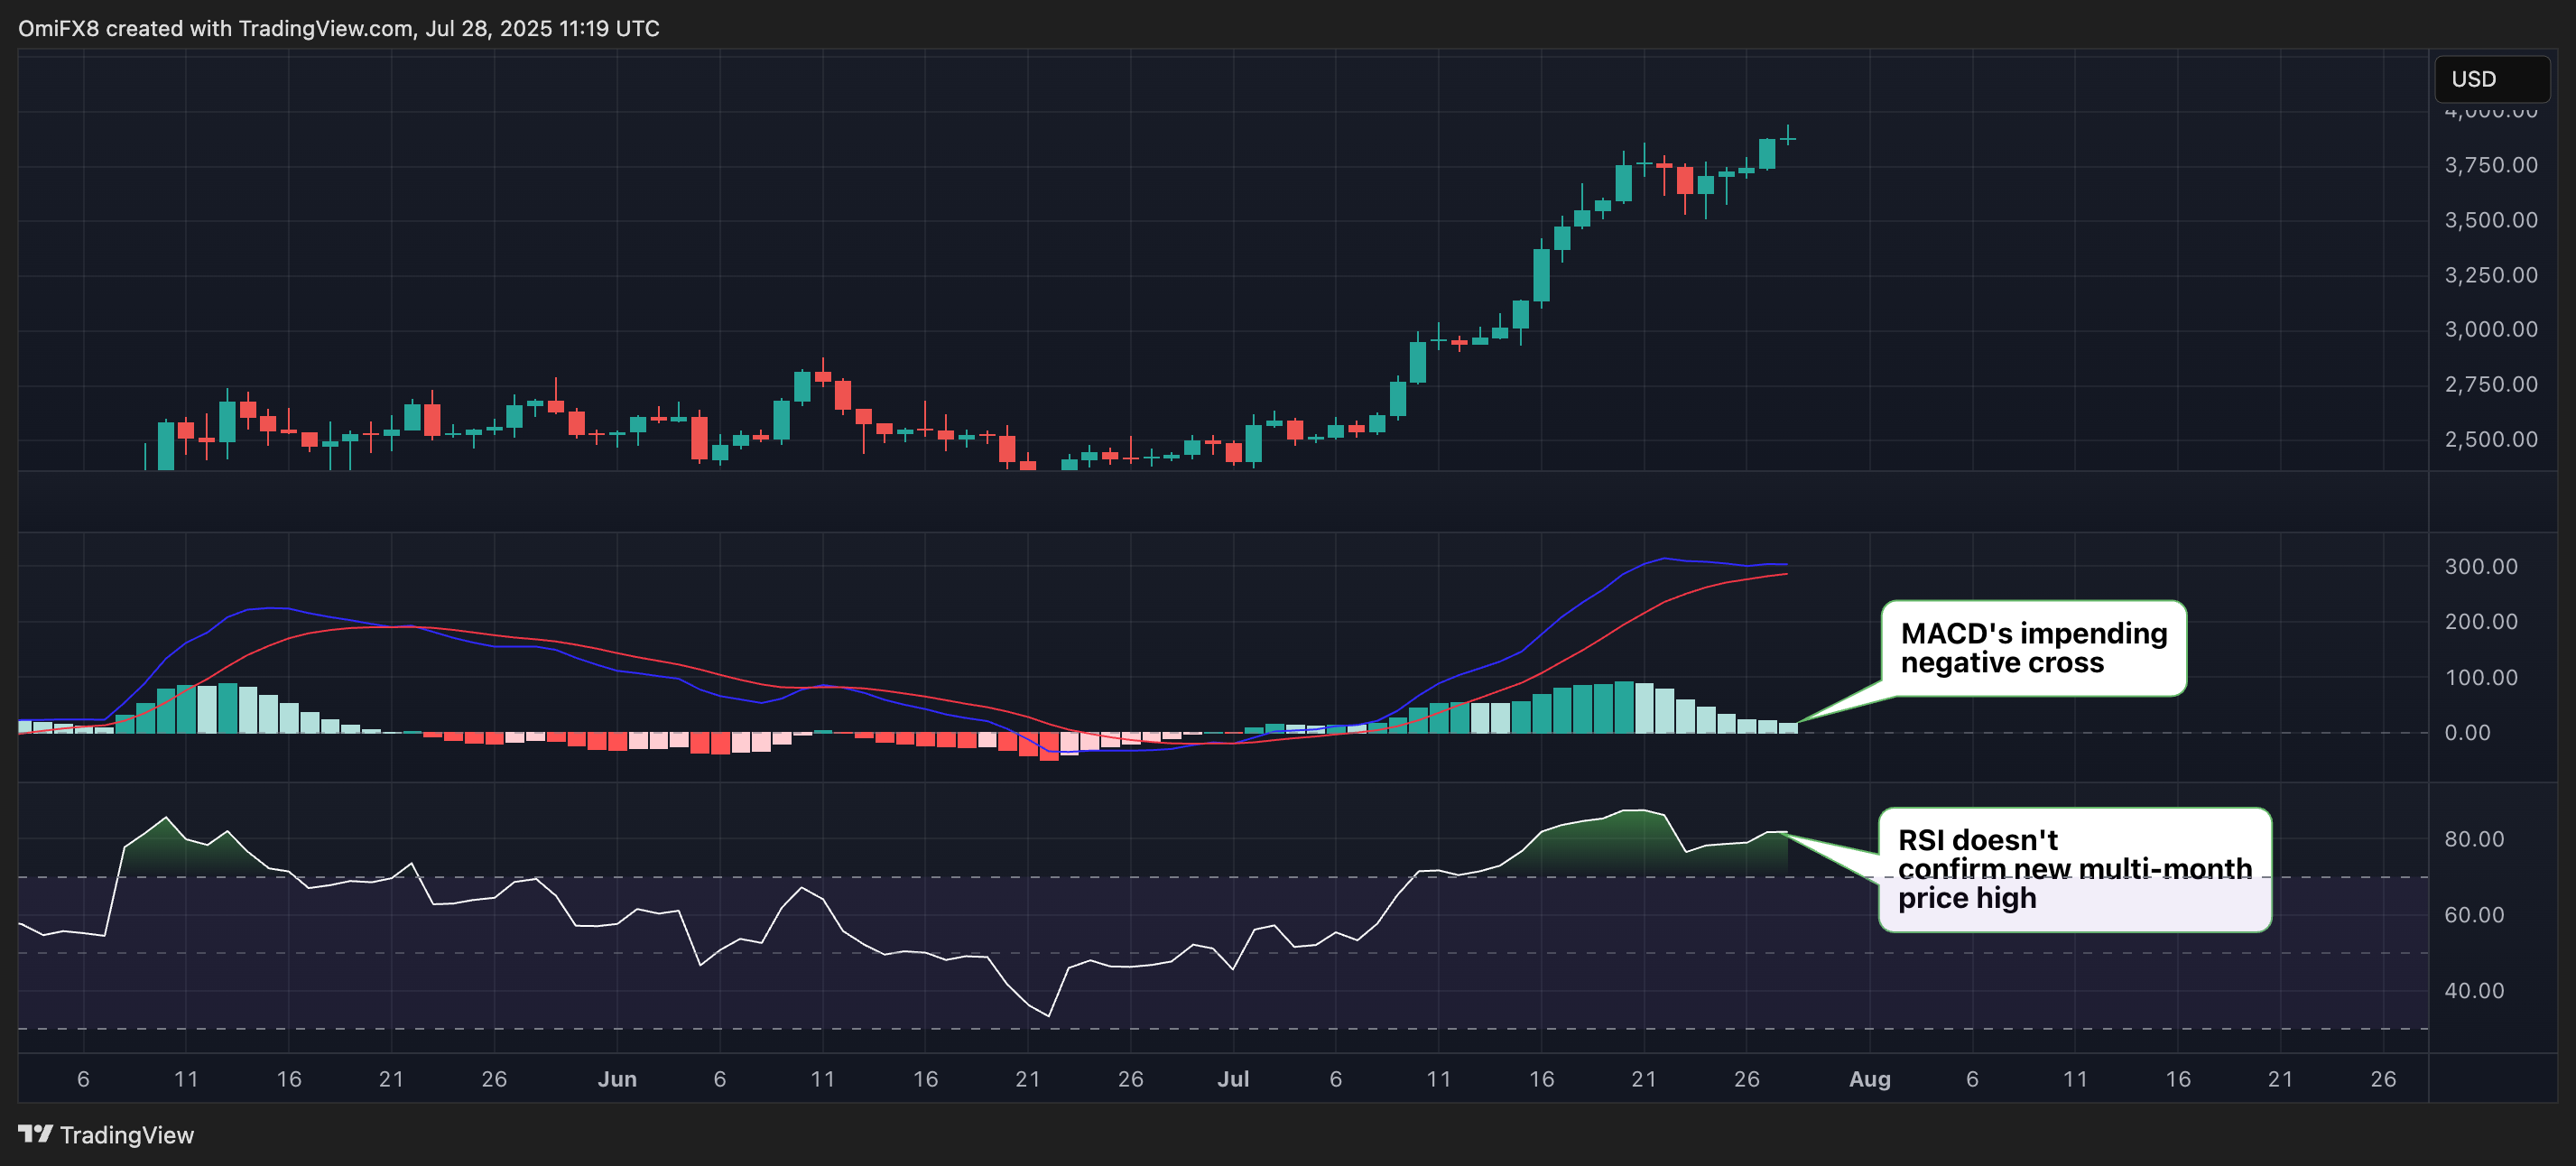
The higher low of $3,510 established on Thursday remains key support, below which, the risk of an extended slide would increase. On the higher side, the $3,900-$4,100 is the key resistance range from 2024.
- AI’s take: The MACD is flashing an impending negative cross, signaling weakening bullish momentum, while the RSI shows bearish divergence, failing to confirm new price highs. These indicators collectively point to a loss of upward thrust, increasing downside risk.
- Resistance: $4,000, $4100, $4,382.
- Support: $3,770 (daily low), $3,510, $3,000.
XRP: Retreats from support-turned-resistance
XRP (XRP) has reversed the gains from the Asian session, retreating from near the former support-turned-resistance level at $3.35. The pullback appears to have legs, as the hourly chart’s RSI has violated the bullish trendline and the MACD histogram has crossed below zero, signaling a bearish shift in momentum.
This structure favors a retest of the July 24 low of $2.96, below which, the focus would shift to the May high of $2.65.
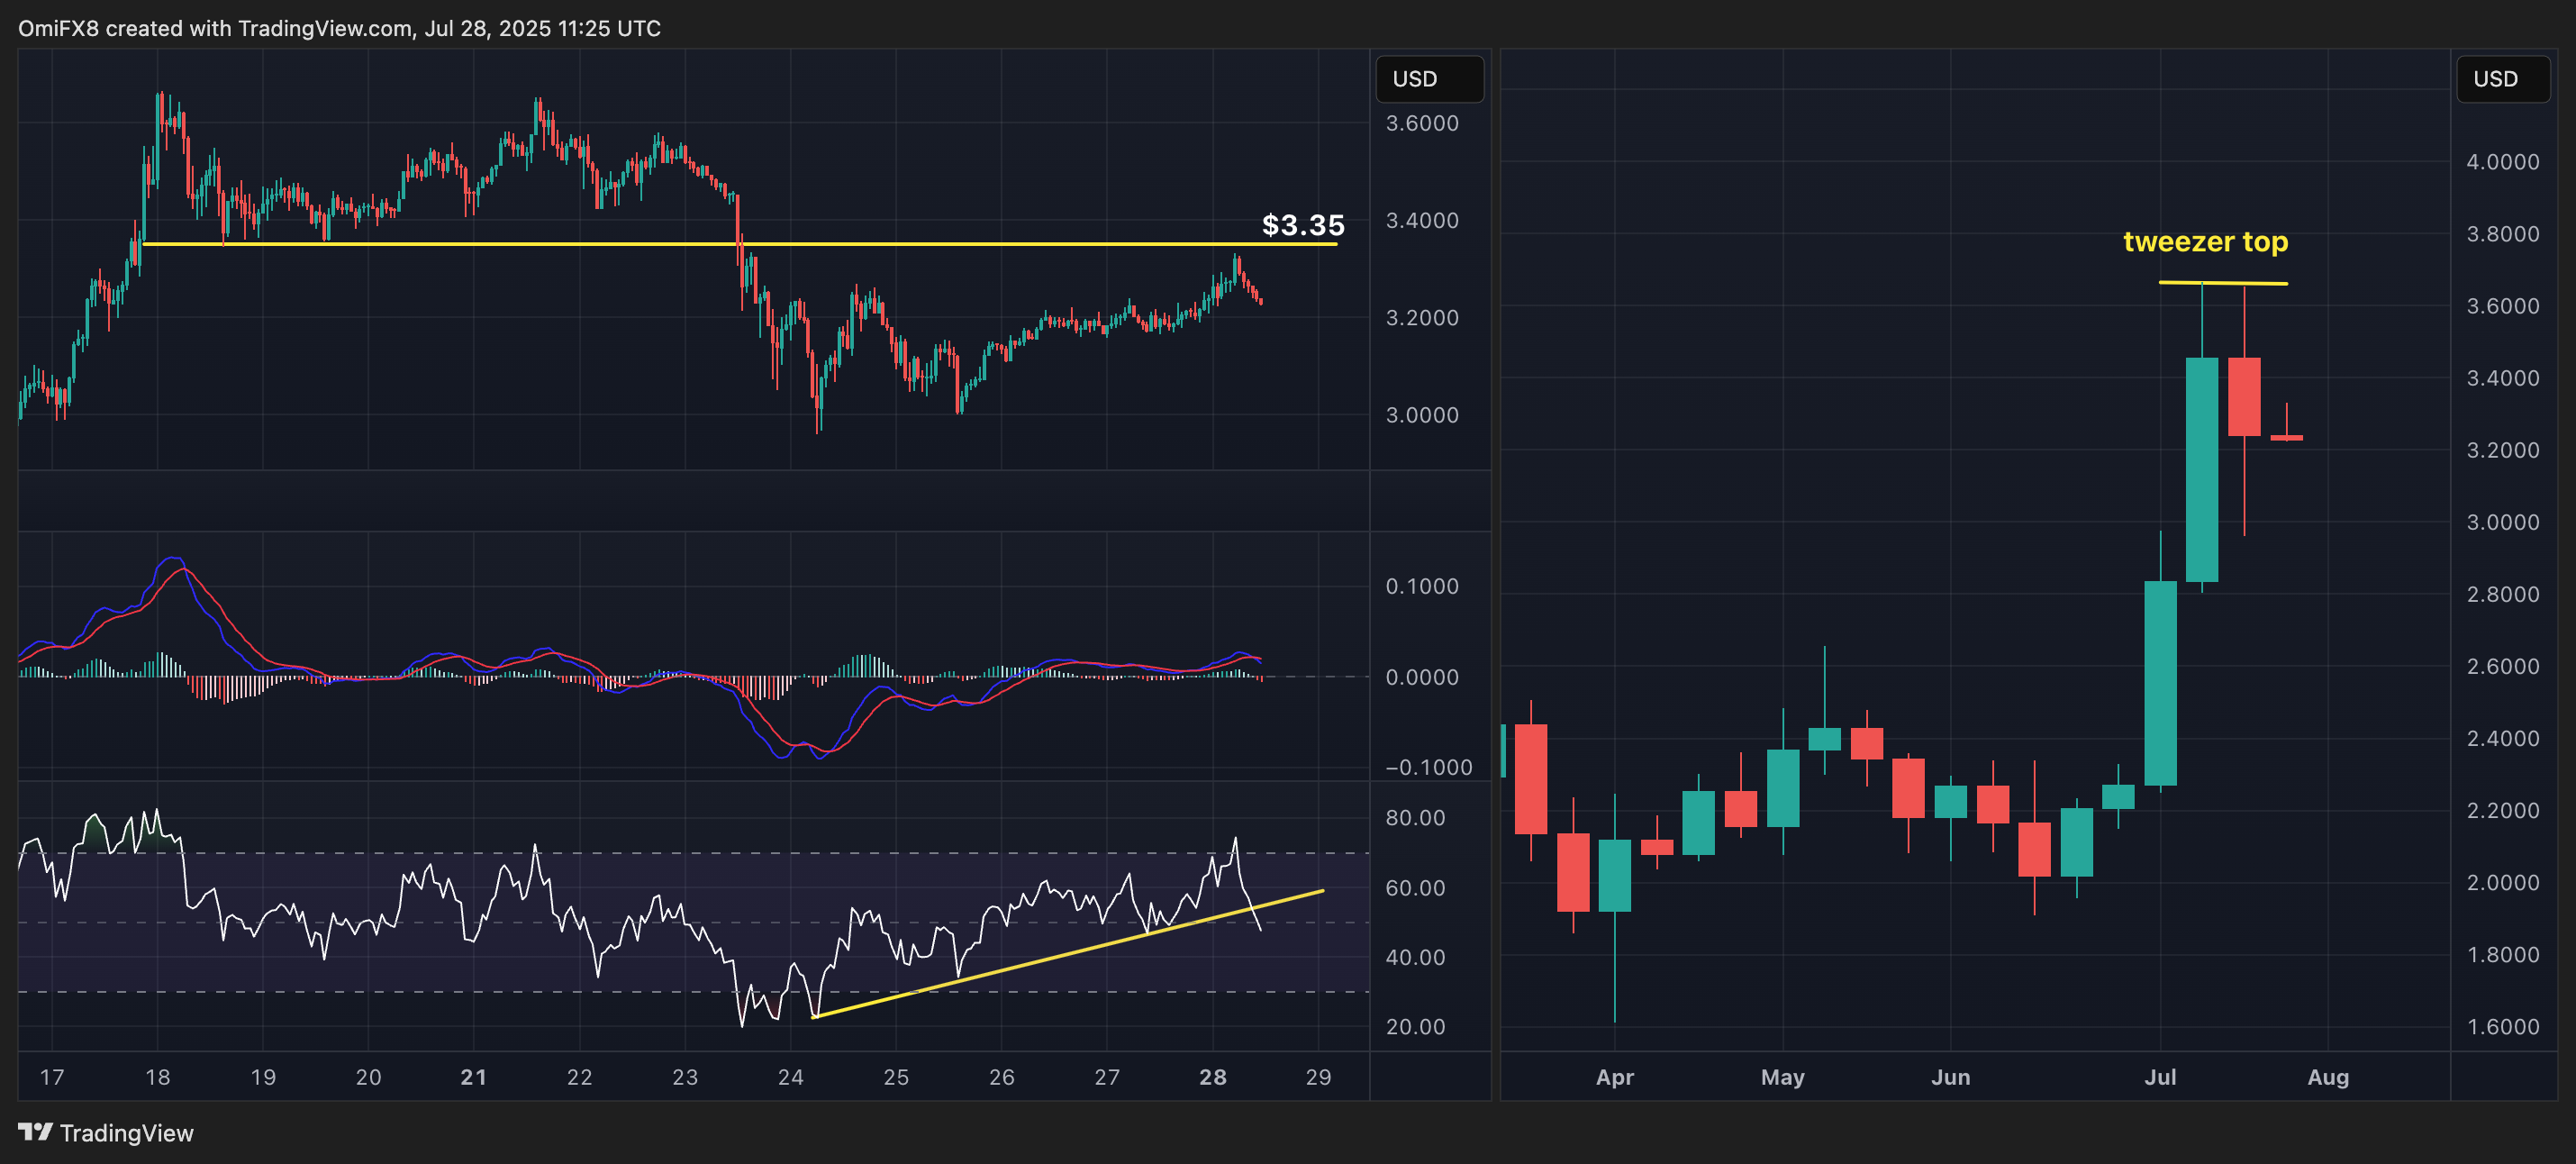
The tweezer top pattern on the weekly chart, characterized by consecutive candlesticks with highs at $3.65, also suggests a bearish shift in momentum.
- AI’s take: XRP’s impressive rally has been capped by a significant “tweezer top” candlestick pattern, a strong bearish reversal signal that warns of potential downside from its multi-year highs.
- Resistance: $3.35, $3.65, $4.00.
- Support: $2.96, $2.65, $2.44 (the 200-day SMA)
Solana: Not out of the woods yet
SOL’s (SOL) price has recovered to trade above the hourly chart Ichimoku cloud, establishing higher lows to suggest renewed upward momentum and a possible retest of $200, the upper end of the ascending channel.
Still, we are not out of the woods yet, as the tweezer top formation at $205-$206 on the daily chart remains valid. Hence, a move below $184, the higher low, cannot be ruled out and will likely lead to an accelerated pullback to the 200-day SMA at $163.
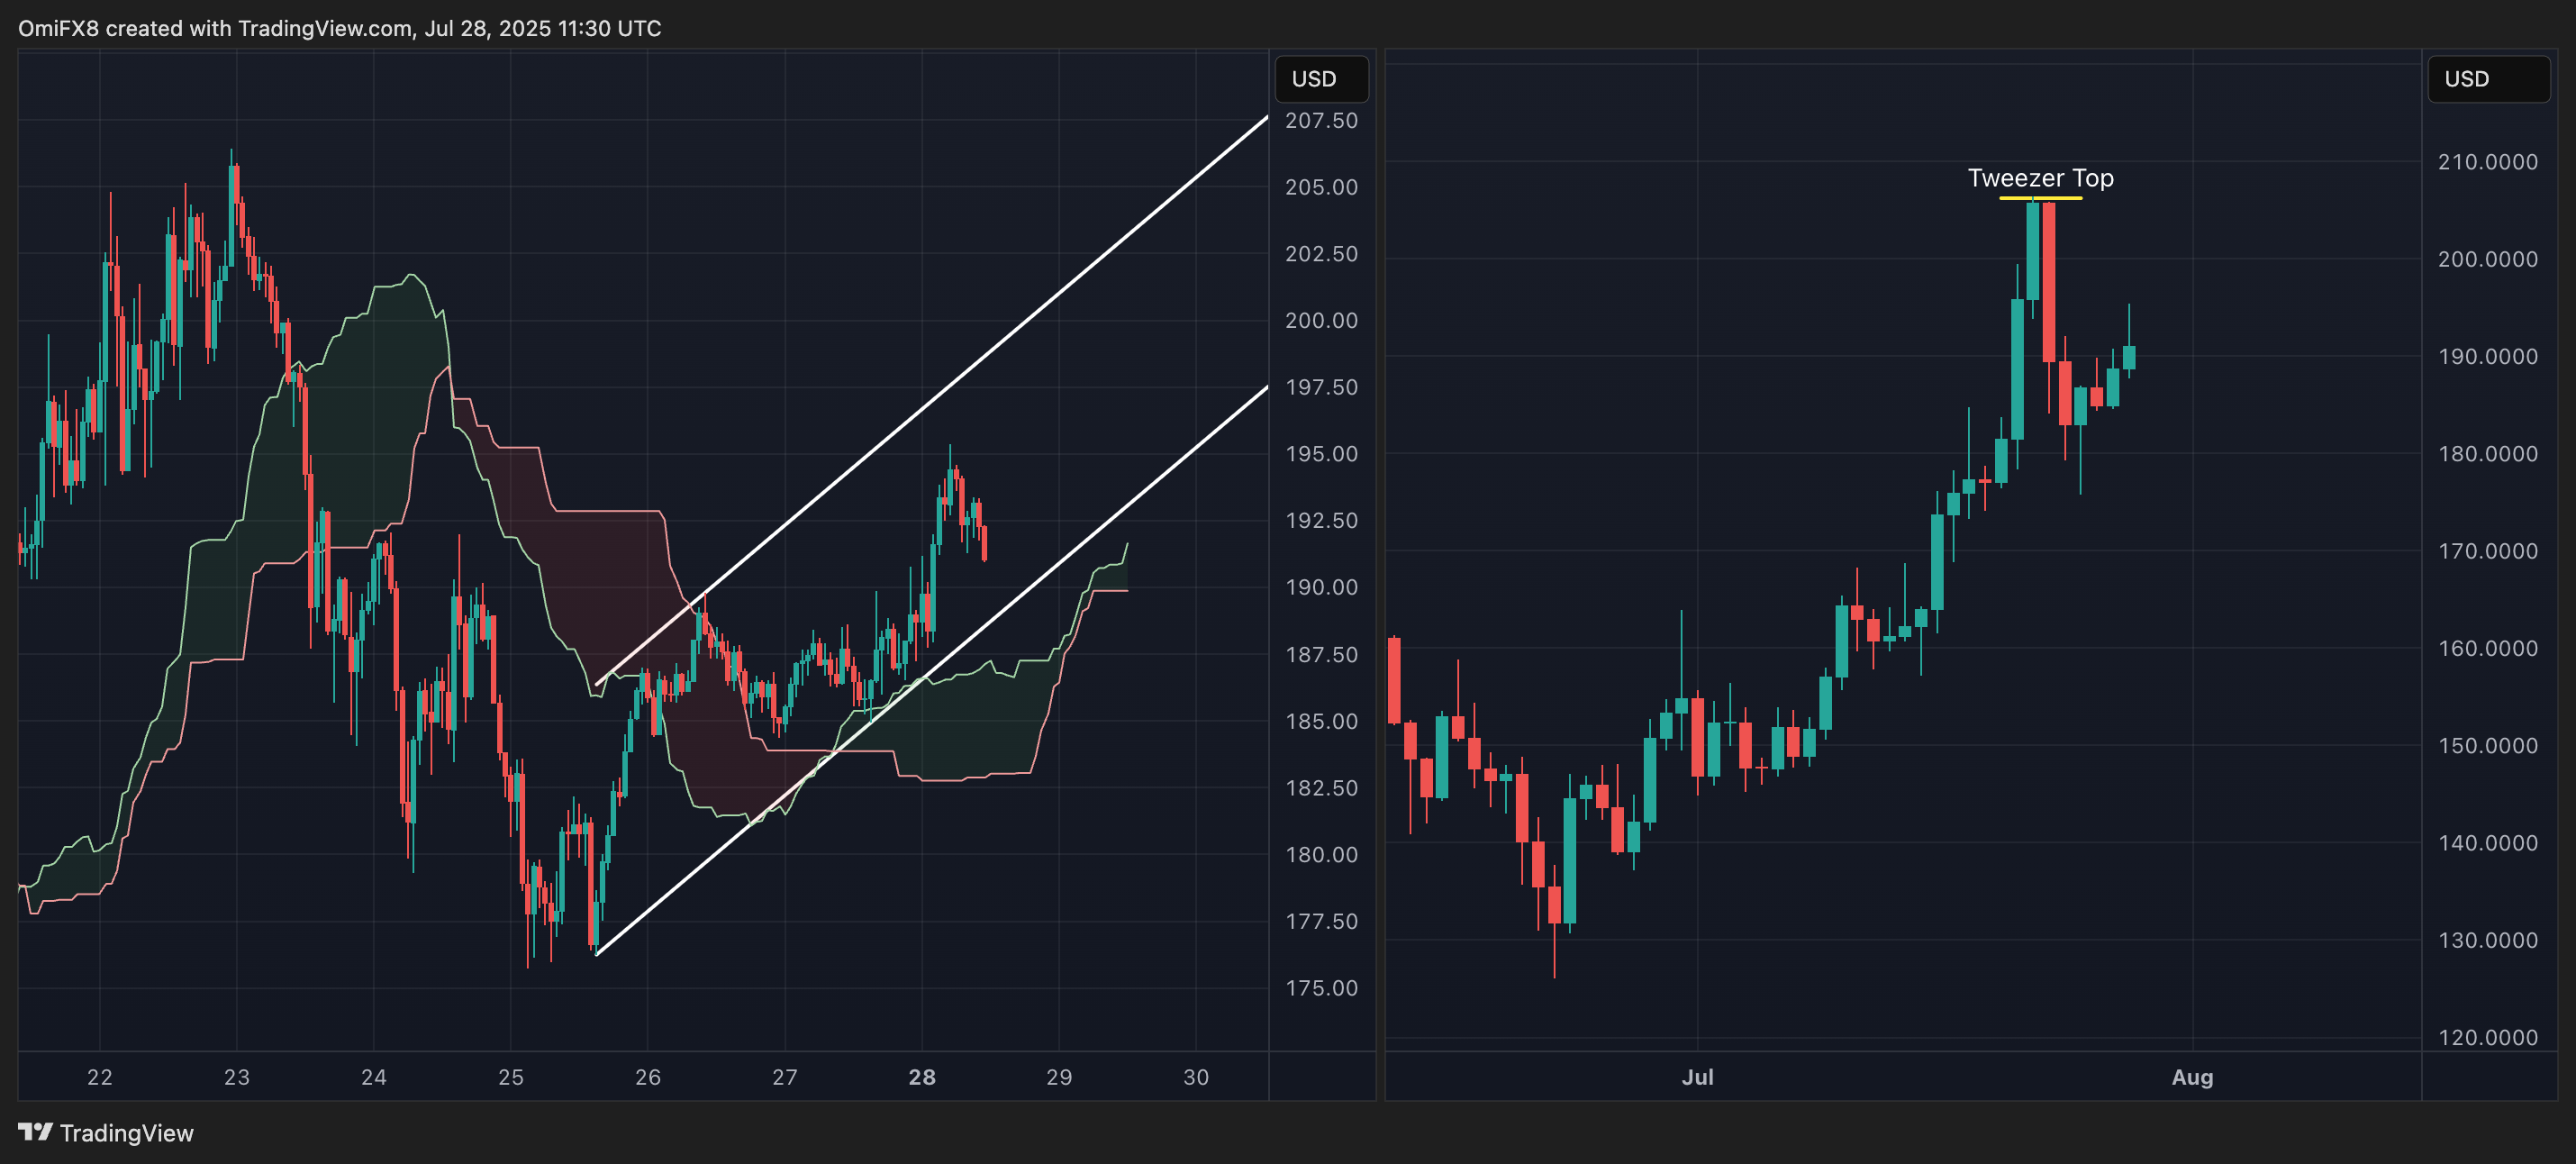
- AI’s take: Solana’s impressive July rally has produced a “Tweezer Top” candlestick pattern at its peak, signaling a strong bearish reversal that suggests significant selling pressure has entered the market.
- Resistance: $205-$206, $218, $252.
- Support: $184, $163, $126.

