This is a daily analysis by CoinDesk analyst and Chartered Market Technician Omkar Godbole.
The bitcoin (BTC) rally has stalled, raising the possibility of a potentially bearish technical formation: a double top.
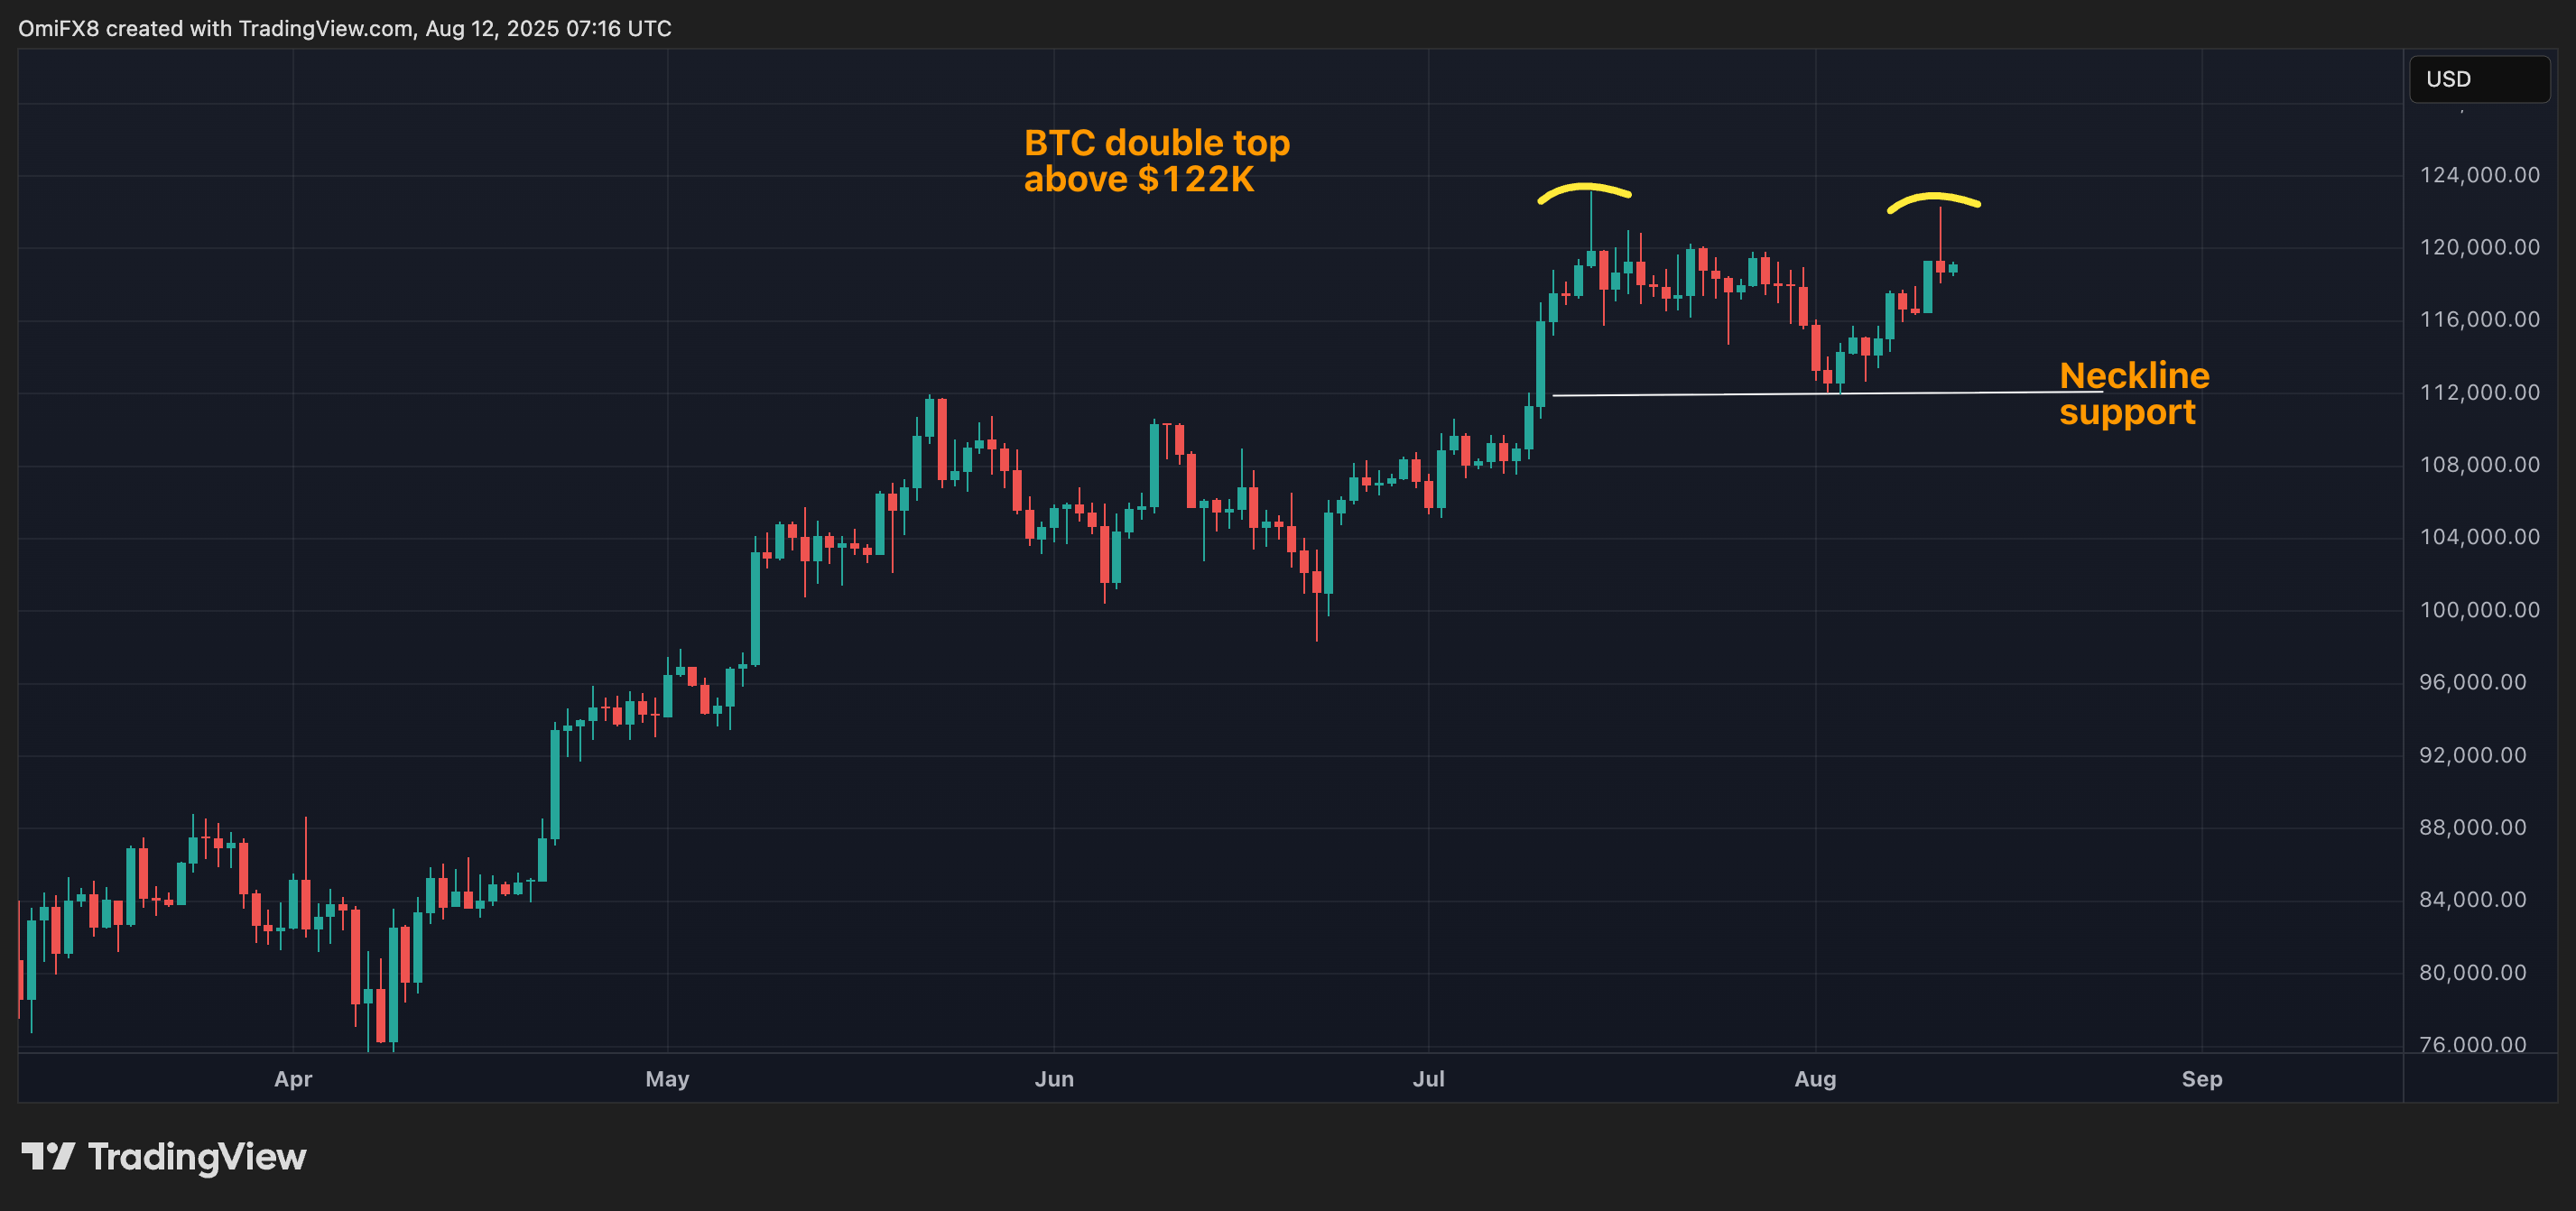
A close examination of the daily chart reveals that bulls failed to sustain a rally above the key Fibonacci level of $122,056 on Monday, a performance that precisely mirrors a similar rejection on July 14, according to data source TradingView.
This dual failure to establish a foothold above the key price point, separated by a brief pullback, is a hallmark of the double top pattern. The neckline of this pattern, drawn from the low of $111,982 reached during the brief pullback, is the key level to watch on the downside.
A decisive move below that level would confirm the double top breakdown, potentially opening the door for a sell-off to $100,000. That level is arrived at by subtracting the gap between the twin peaks and the neckline from the neckline level in what’s known as the measured move method of calculating targets.

Early this year, BTC double-topped near $100,000, eventually falling to lows under $75,000 in early April. The double top comprises two peaks separated by a trough and takes roughly two to six weeks to form. The gap between the two peaks must be equal to or less than 5%, with the spread between peaks and the trough being at least 10%, according to technical analysis theory.
These, however, are guidelines and not rules, meaning the backdrop is more important – the pattern should appear after a prolonged uptrend to be valid, which is the case with BTC.
- Resistance: $120,000, $122,056, $123,181.
- Support: $114,295 (the 50-day SMA), $111,982, $100,000.
Bears gain an upper hand ahead of U.S. CPI
The dual failure of Bitcoin bulls to sustain gains above $122,000 indicates a clear case of buyer exhaustion, giving bears a significant upper hand as the market heads into today’s CPI release.
This exhaustion of buying pressure means the market is now particularly vulnerable to a hotter-than-expected U.S. inflation report due Tuesday. In other words, the buying momentum is not strong enough to absorb the potential selling pressure triggered by an elevated CPI and the resulting drop in the Fed rate cut bets. In this scenario, the market could experience a rapid decline.
Read more: Bitcoin $115K Bets In Demand as Downside Fear Grips Market Ahead of U.S. CPI Report

