

Bitcoin (BTC) dipped below $92,000 during the overnight trade, revisiting levels that have proven resilient multiple times since December. However, the latest move comes with a notable uptick in perpetual futures open interest and price action that indicates seller dominance.
The number of open futures bets or open interest in the BTC/USDT pair trading on Binance rose by roughly 12,000 BTC (worth over $1 billion) as BTC’s price fell from $96,000 to under $92,000, according to data tracked by Coinglass.
An uptick in open interest alongside a price decline is said to represent an influx of bearish short positions. In other words, traders likely opened fresh shorts as the price dropped, perhaps in anticipation of an extended sell-off.
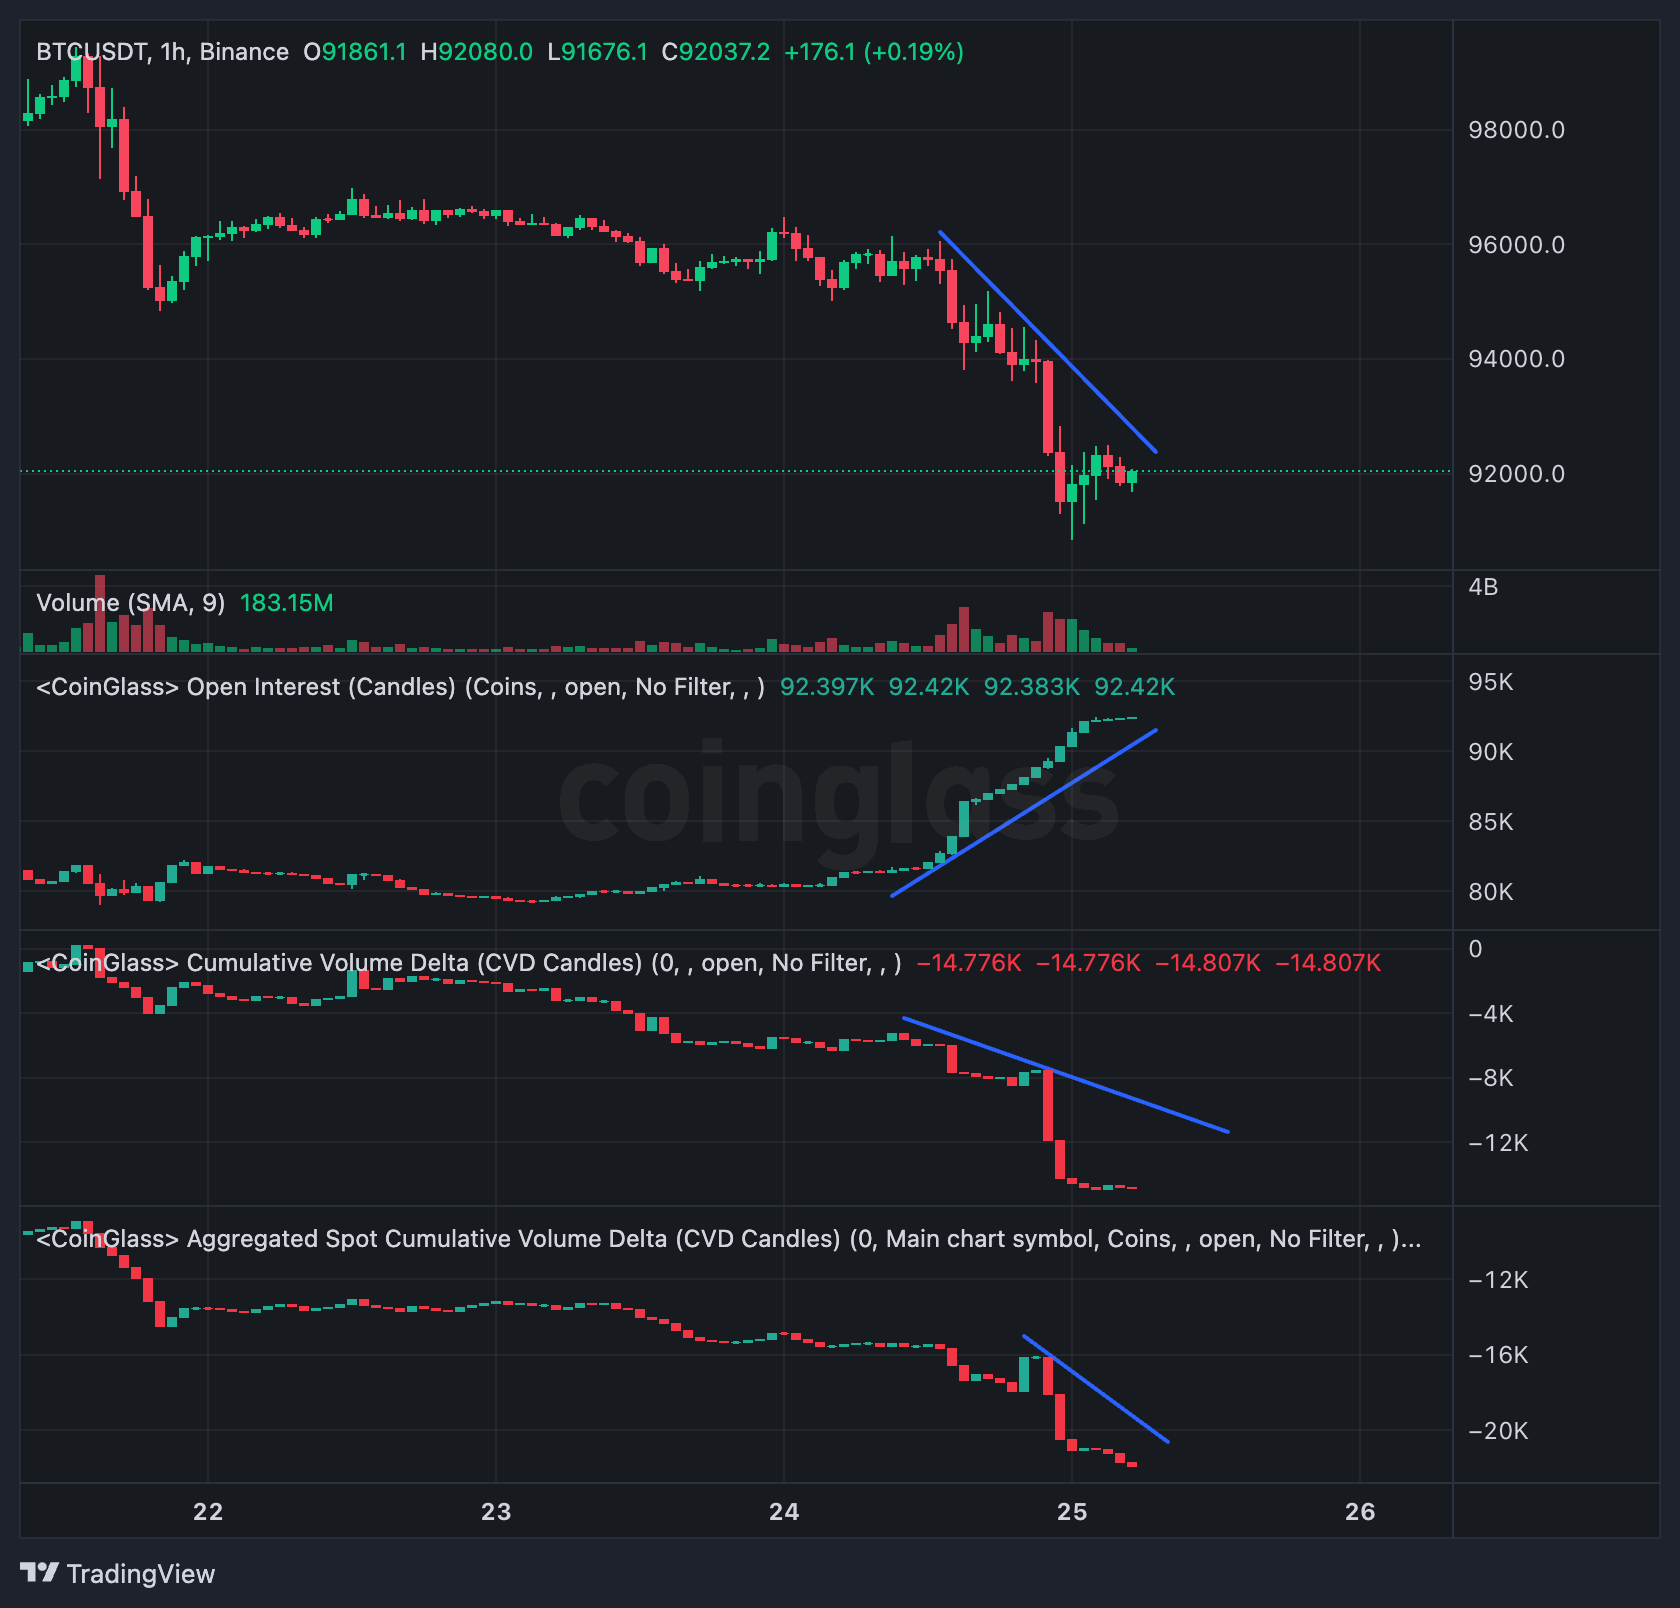
The cumulative volume delta (CVD) across both futures and spot markets on the exchange was already negative and has deepened further with the price drop, indicating that selling pressure has outpaced buying activity.
The CVD measures the net capital flows into the market, where positive and rising figures indicate buyer dominance, while negative values reflect increased selling pressure.
BTC chalks out bearish marubozu candle
Bitcoin dropped 4.86% on Monday with sellers dominating the price action throughout the day.
That’s reflected in the shape of Monday’s candlestick, which features negligible upper and lower shadows and a prominent red body. In other words, opening and closing prices are almost the same, a sign buyers had little say in the price action.
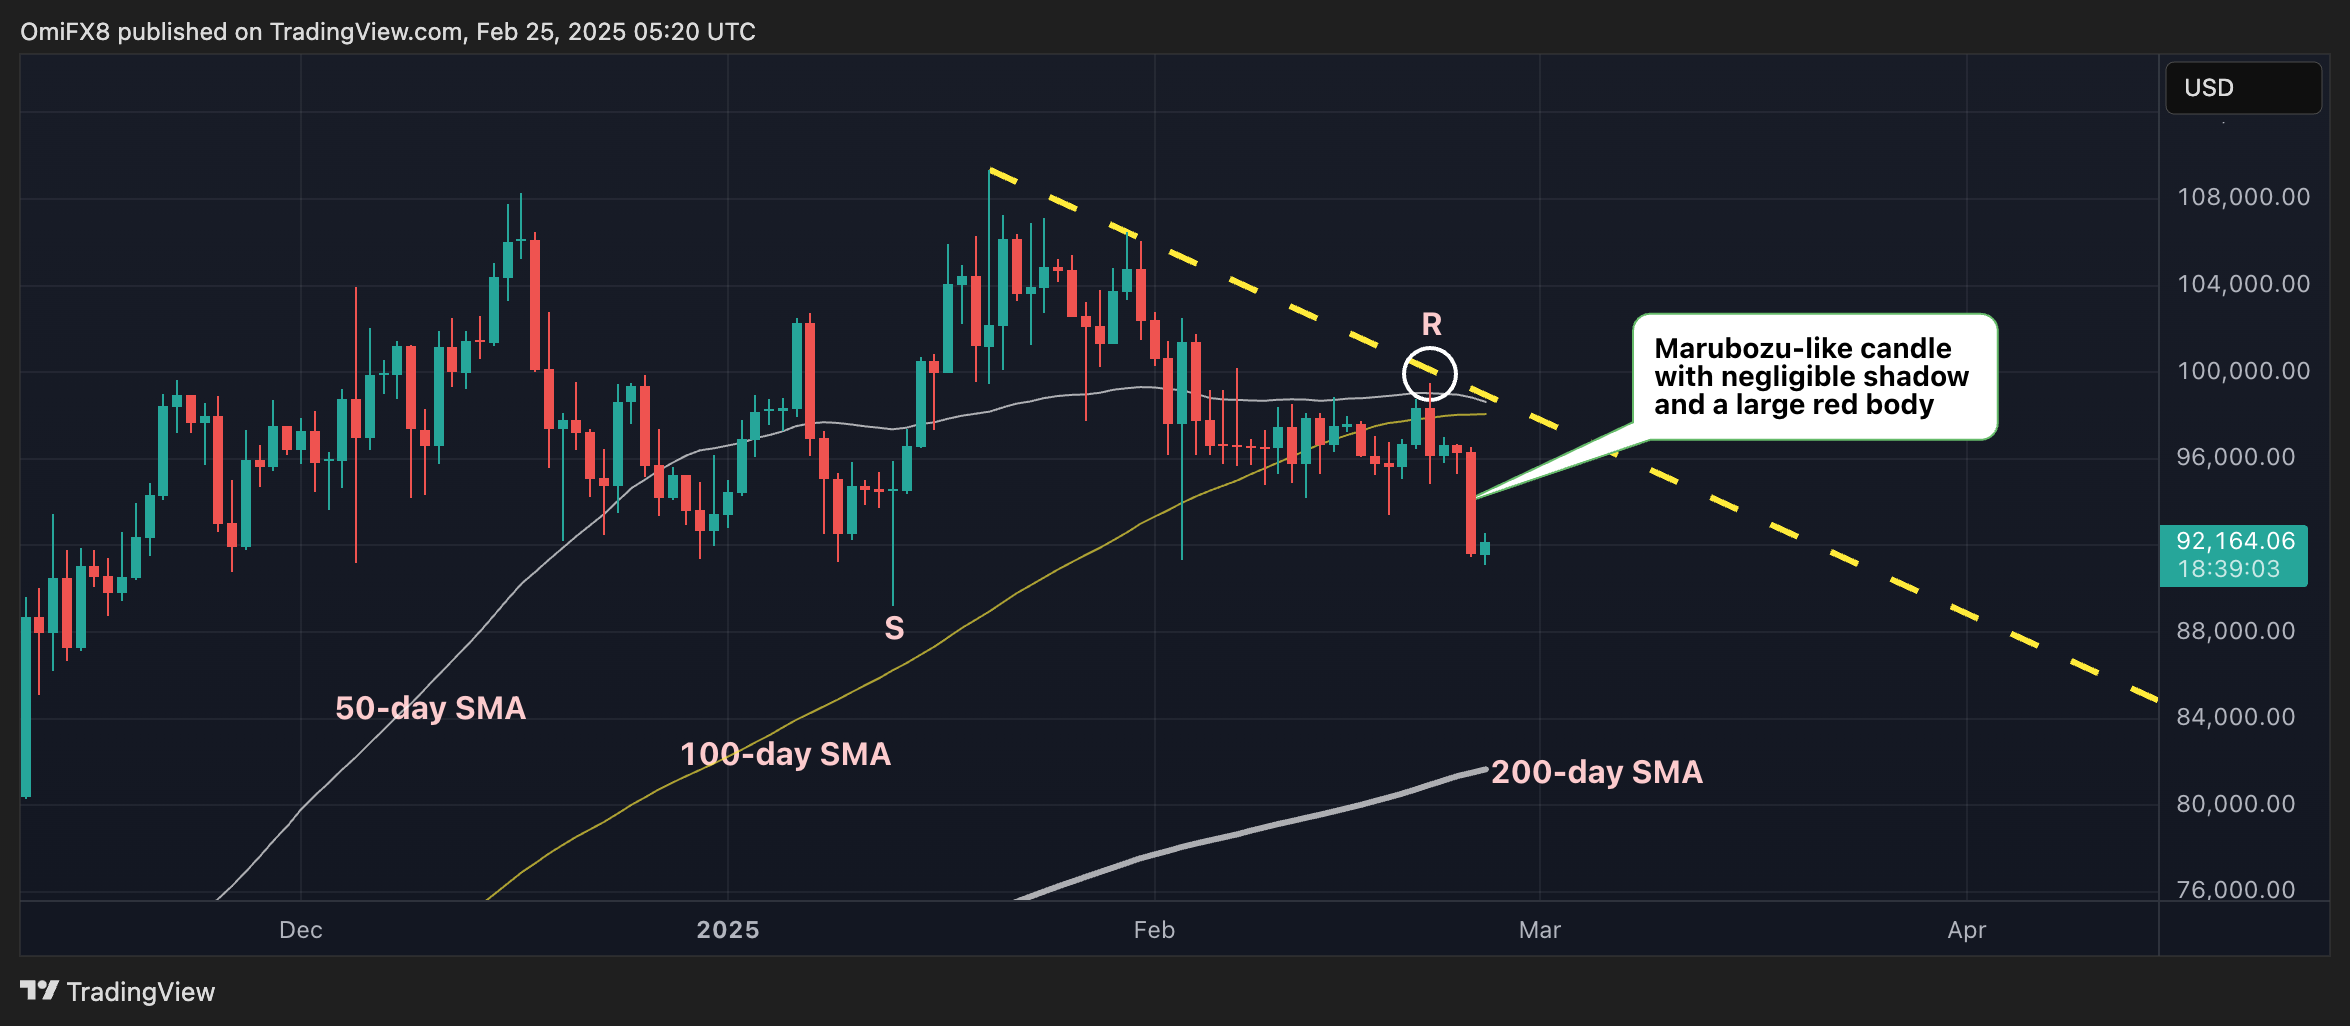
Technical analysts categorize this as a bearish marubozu pattern. The appearance of the bearish candlestick while prices hover below key 50- and 100-day simple moving averages (SMA) may embolden sellers, potentially leading to deeper losses.
Support (S) is seen near $89,200, the Jan. 13 low, followed by the 200-day SMA at $81,661. On the flip side, the Feb. 21 high of around $99,520 is the level to beat (R).