This is a daily technical analysis by CoinDesk analyst and Chartered Market Technician Omkar Godbole.
For the past 12 weeks, gold (XAU) has outperformed bitcoin (BTC) in a race to draw bids, but this trend may be on the verge of reversing, according to technical charts.
This year, gold has surged 22% because of haven bids and arbitrage plays involving traders moving physical gold from overseas destinations to the U.S. to take advantage of premiums on Comex.
Bitcoin, meanwhile, has dropped over 8%. That has led to over 25% slide in the bitcoin-gold ratio, representing the per unit USD price of bitcoin relative to the per ounce USD price of gold.
However, the downtrend, represented by trendlines drawn off Jan. 20 and March 3 highs, has been invalidated this week. The ratio topped the trendline over the weekend in a bullish breakout that suggests the cryptocurrency may not outperform gold, potentially catching up with the rally in the yellow metal.
The message is consistent with analysis by Theya Research’s Joe Consorti, which shows bitcoin tends to lag gold by 100 to 150 days.
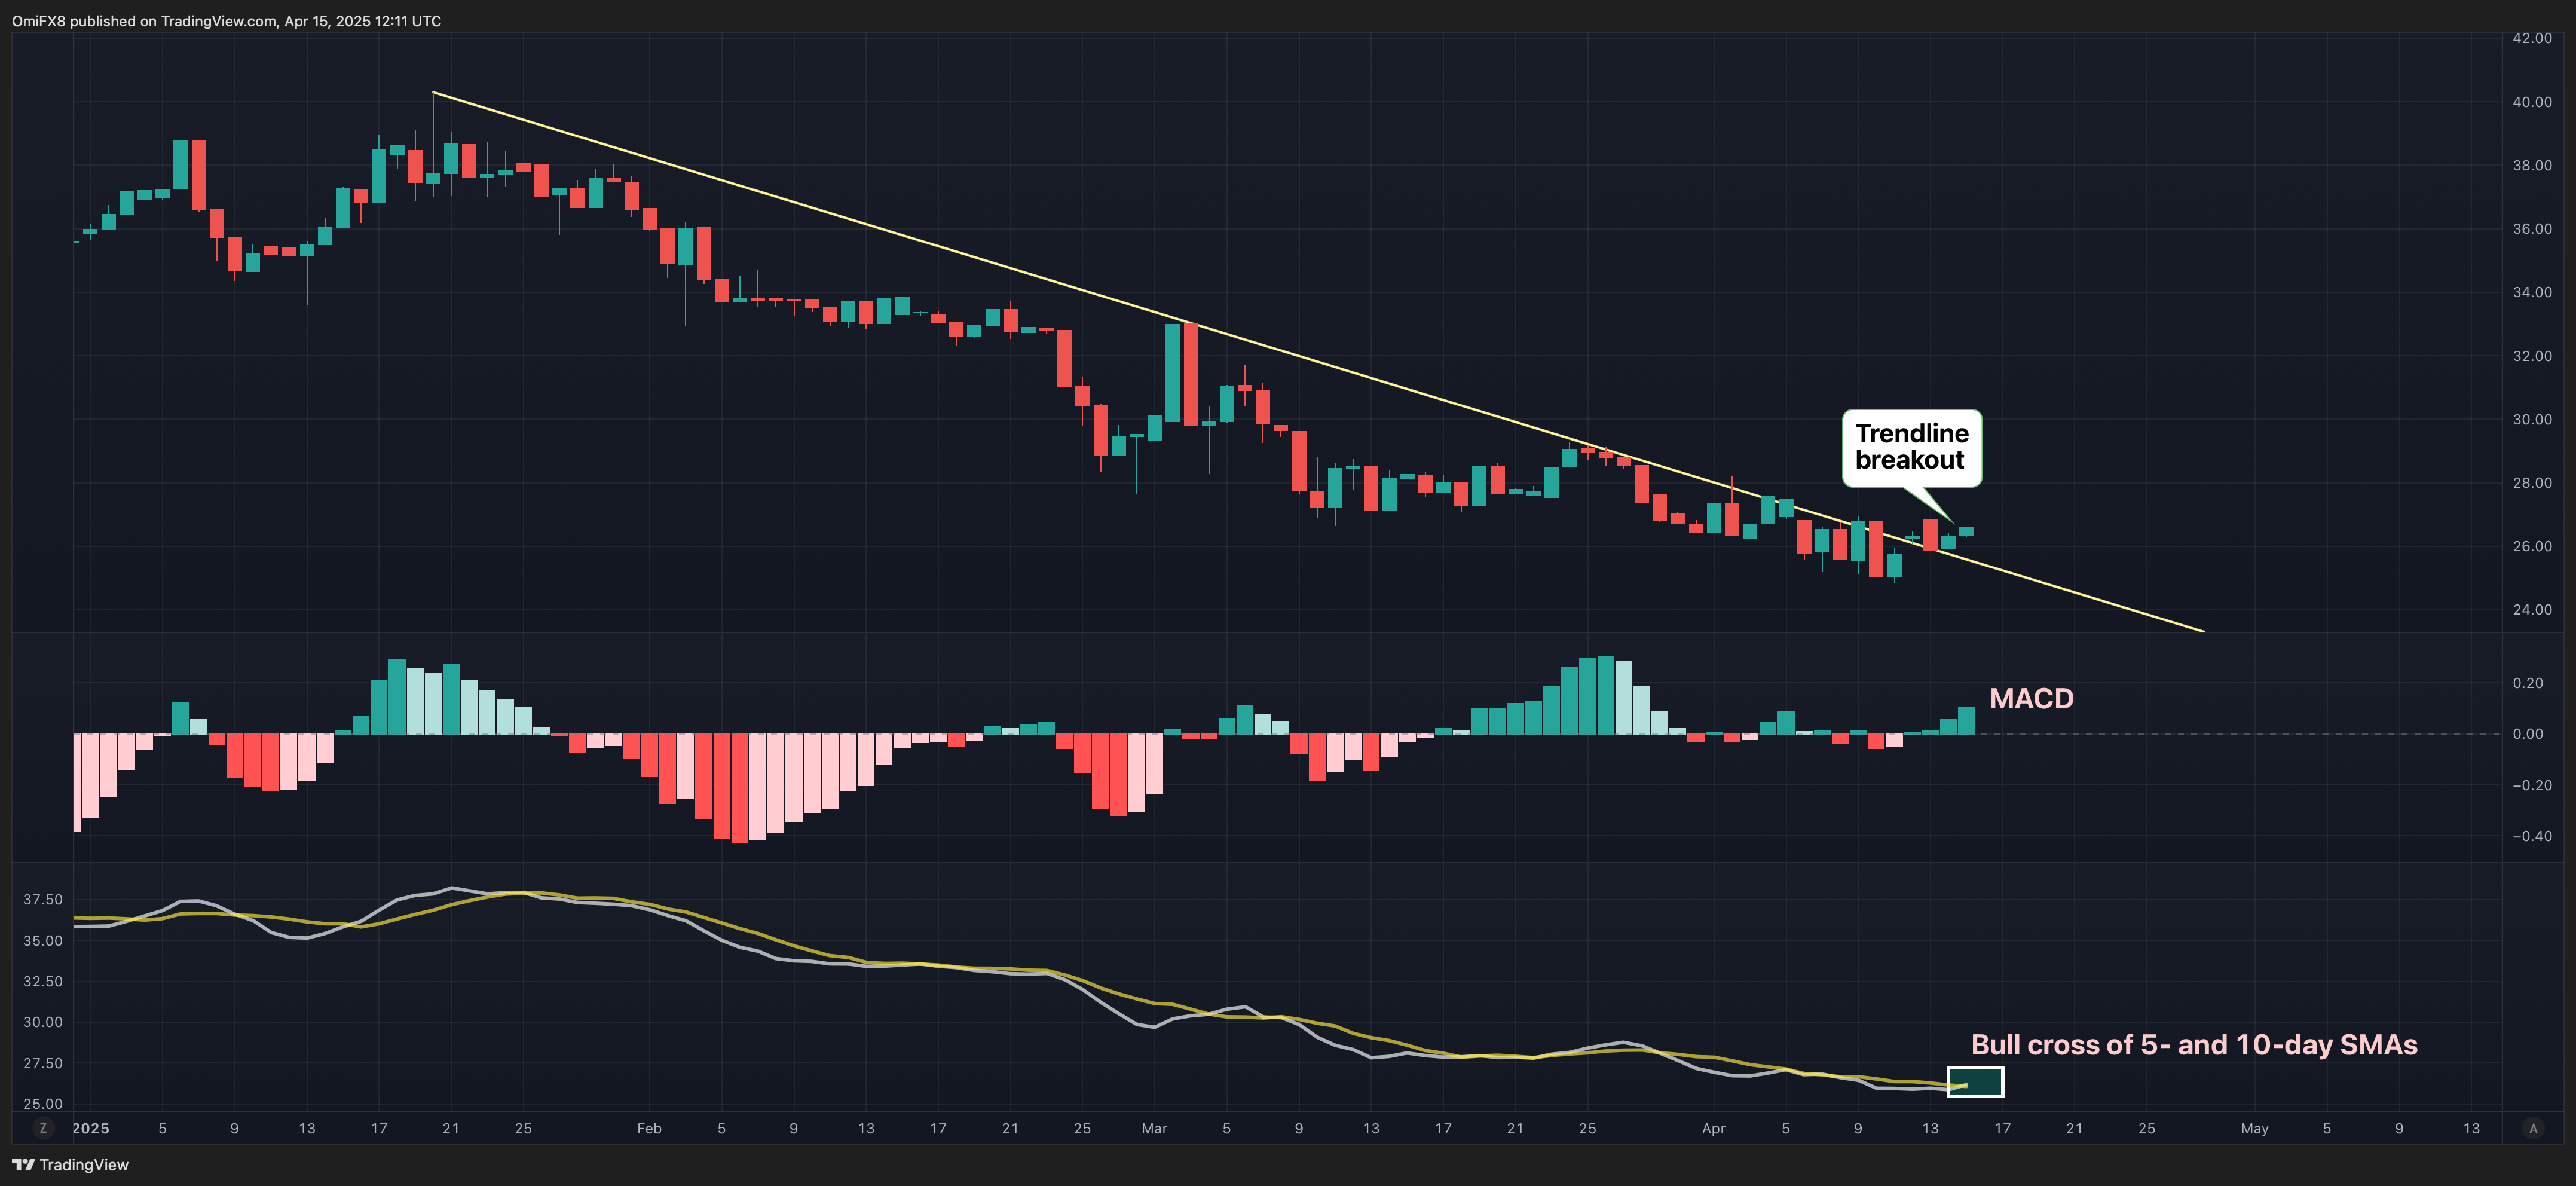
The trendline breakout is accompanied by the MACD’s histogram’s positive flip, signaling a bullish shift in momentum. The bullish crossover of the 5- and 10-day simple moving averages (SMA), seen in the lower pane, suggests the same.
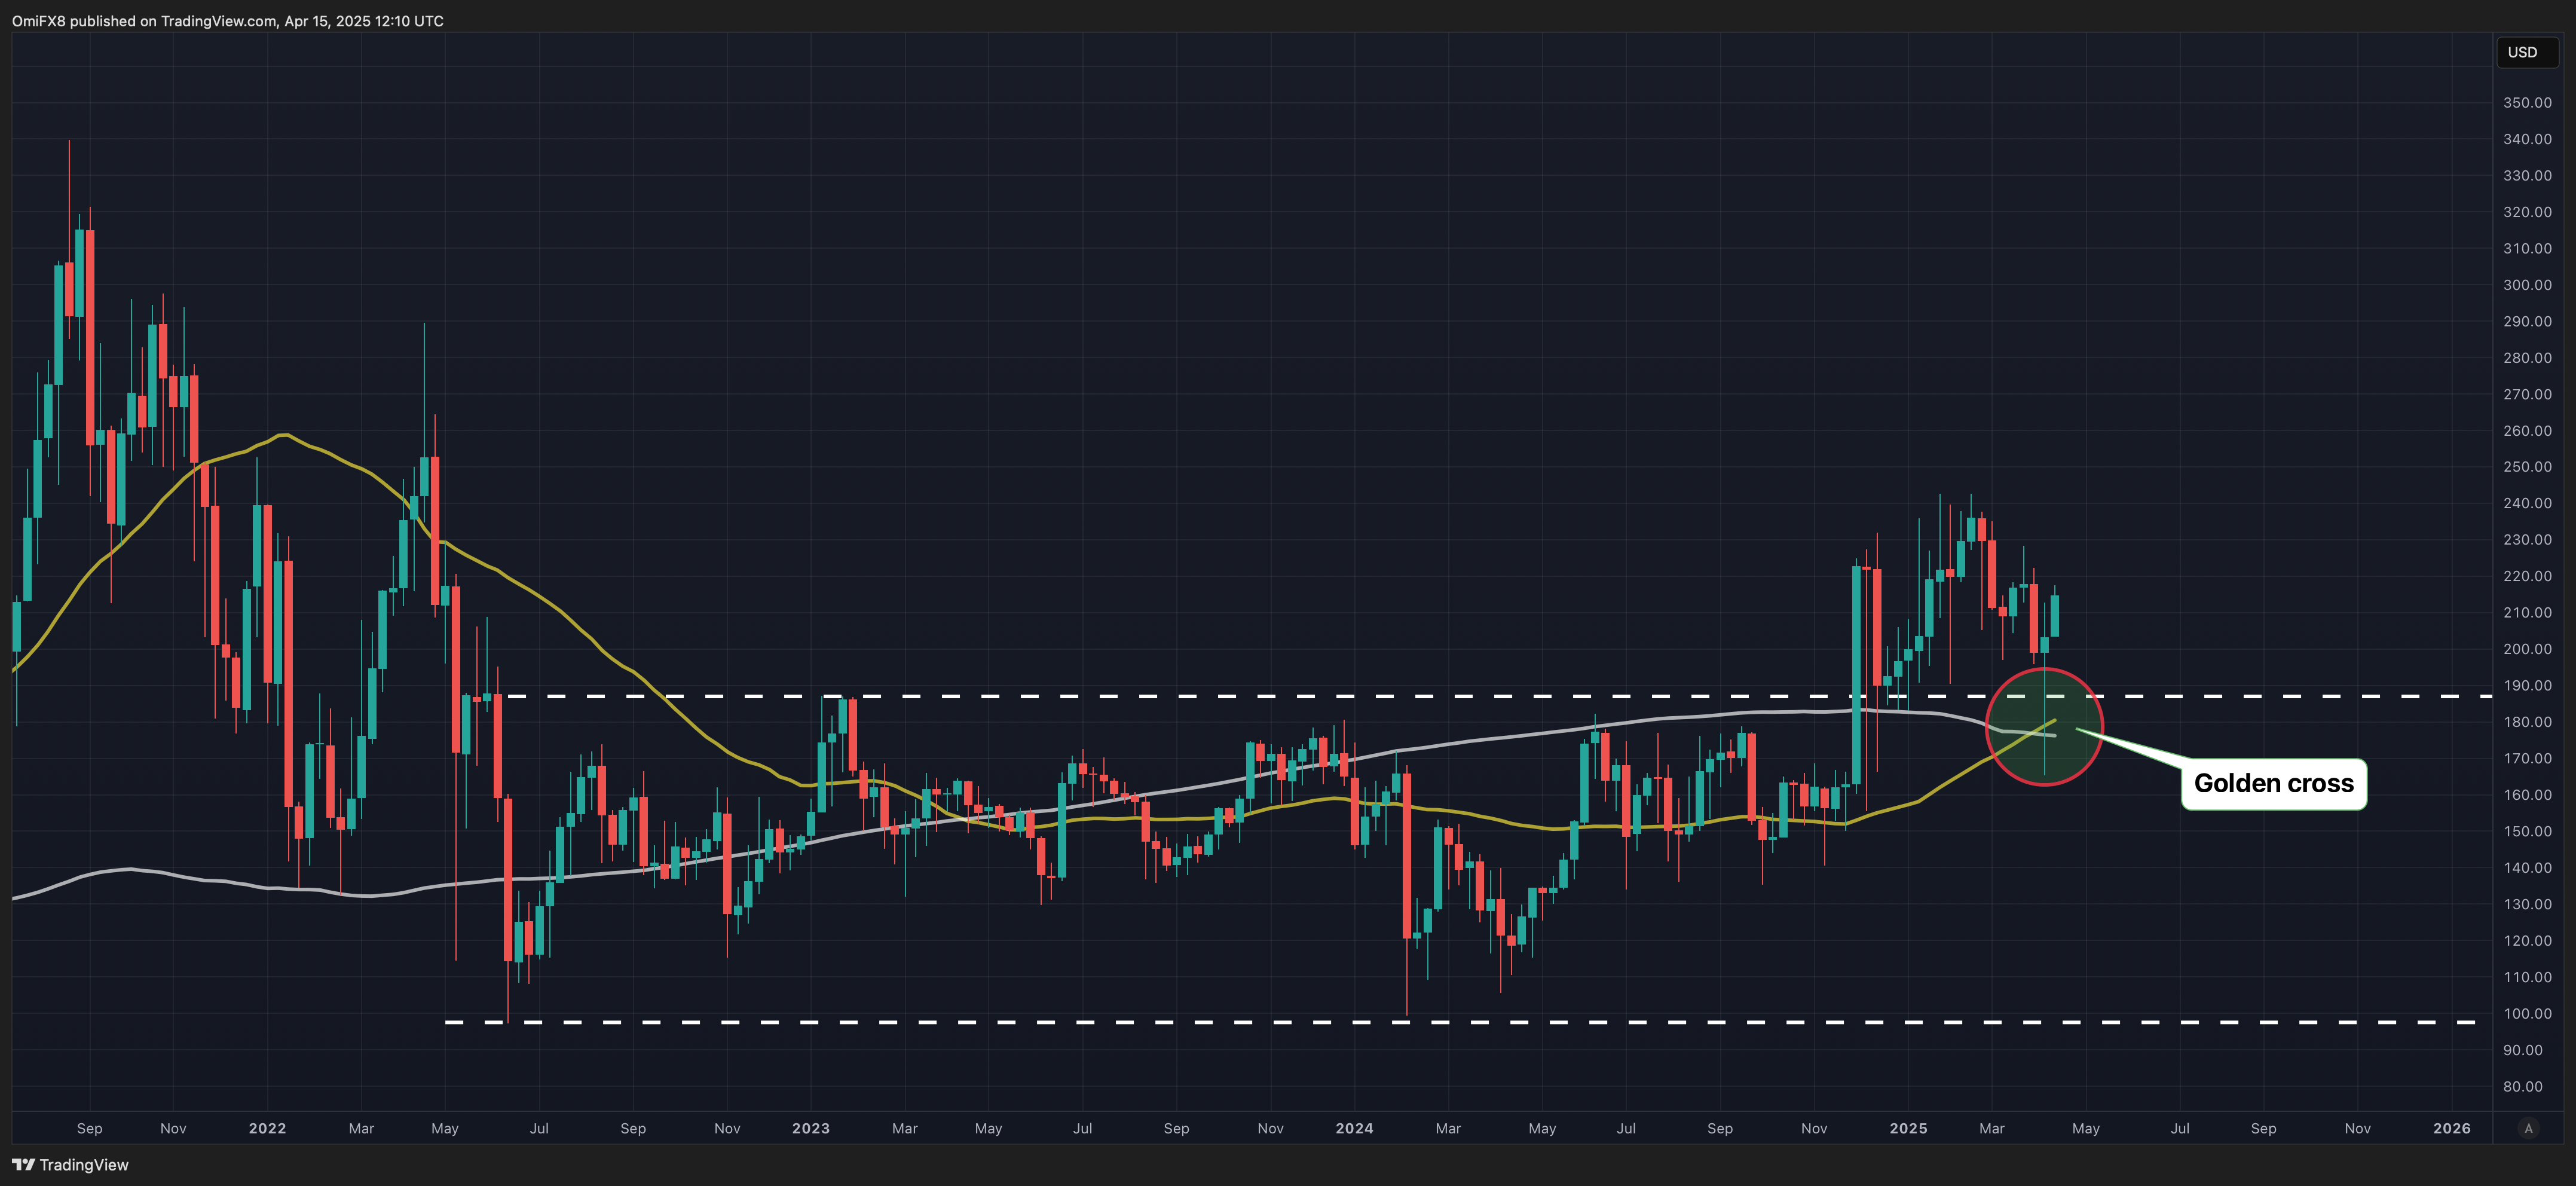
XMR’s golden cross
The outlook for privacy-focused monero (XMR) appears constructive following the past week’s sharp recovery from $165 to over $200 that left a “long-tailed” candle on the weekly chart, a sign of dip demand.
The token has broken out of a prolonged consolidation pattern, with the 50-week SMA moving above the 200-week SMA to confirm a golden crossover, an indicator representing a long-term bullish shift in momentum.
The immediate resistance is seen at $242, the February high, followed by $289, the April 2022 high, with support at $200 and last week’s low of $165.