This is a daily technical analysis by CoinDesk analyst and Chartered Market Technician Omkar Godbole.
Bitcoin’s BTC broader outlook is constructive, but its short-term prospects remain bleak, according to technical analysis.
The leading cryptocurrency by market value has bounced back to nearly $104,000 from its overnight low of $104.30, alongside positive action in U.S. equity futures.
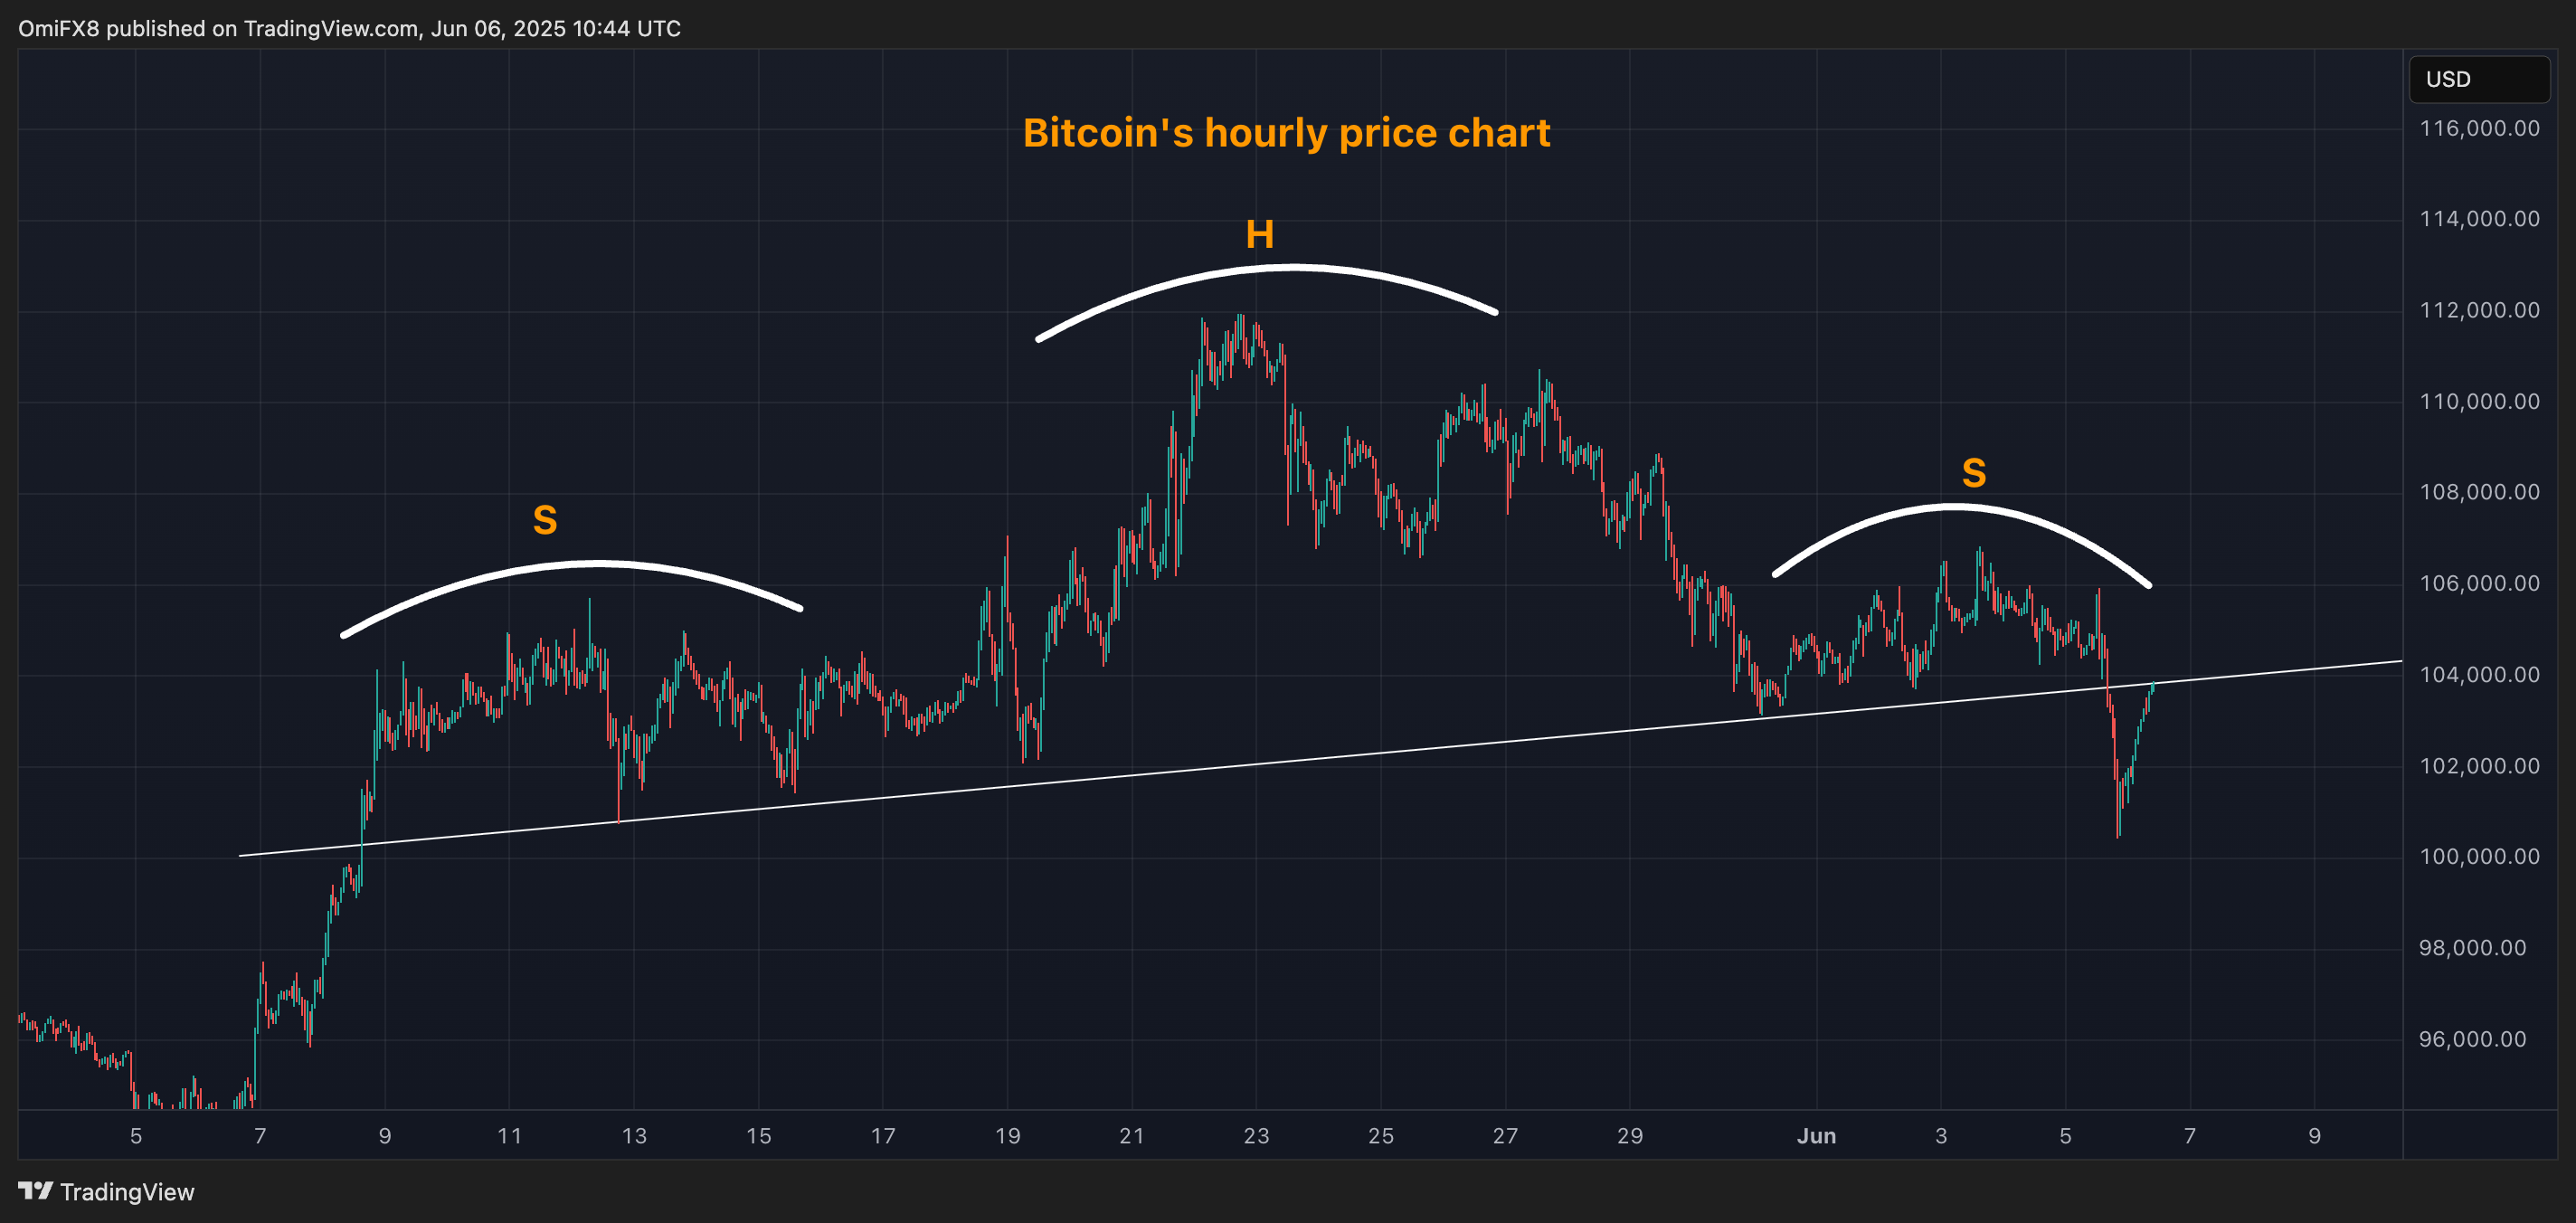
However, a closer look at the hourly price chart reveals that the bounce is likely a classic breakdown and retest play – the cryptocurrency dove out of a head-and-shoulders pattern on Thursday, signalling a short-term bullish-to-bearish trend change, and prices are now revisiting the breakdown point, called the neckline.
This happens because early sellers – those who shorted at the time of the breakdown – are quick to take profits, consistent with the prospect theory of behavioral analysis.
It leads to a bounce that usually runs into fresh selling at the neckline from those who missed the initial breakdown. These fresh shorts lead to the next leg lower.
In other words, BTC is not out of the woods yet, and prices could turn lower from around $104,000, extending the pullback. The immediate support is at $100,000, followed by $95,500. The latter is arrived at by subtracting the height of the H&S pattern from the breakdown point.

On the higher side, a move above $107,000 is needed to invalidate the bearish setup and shift focus to record highs.

