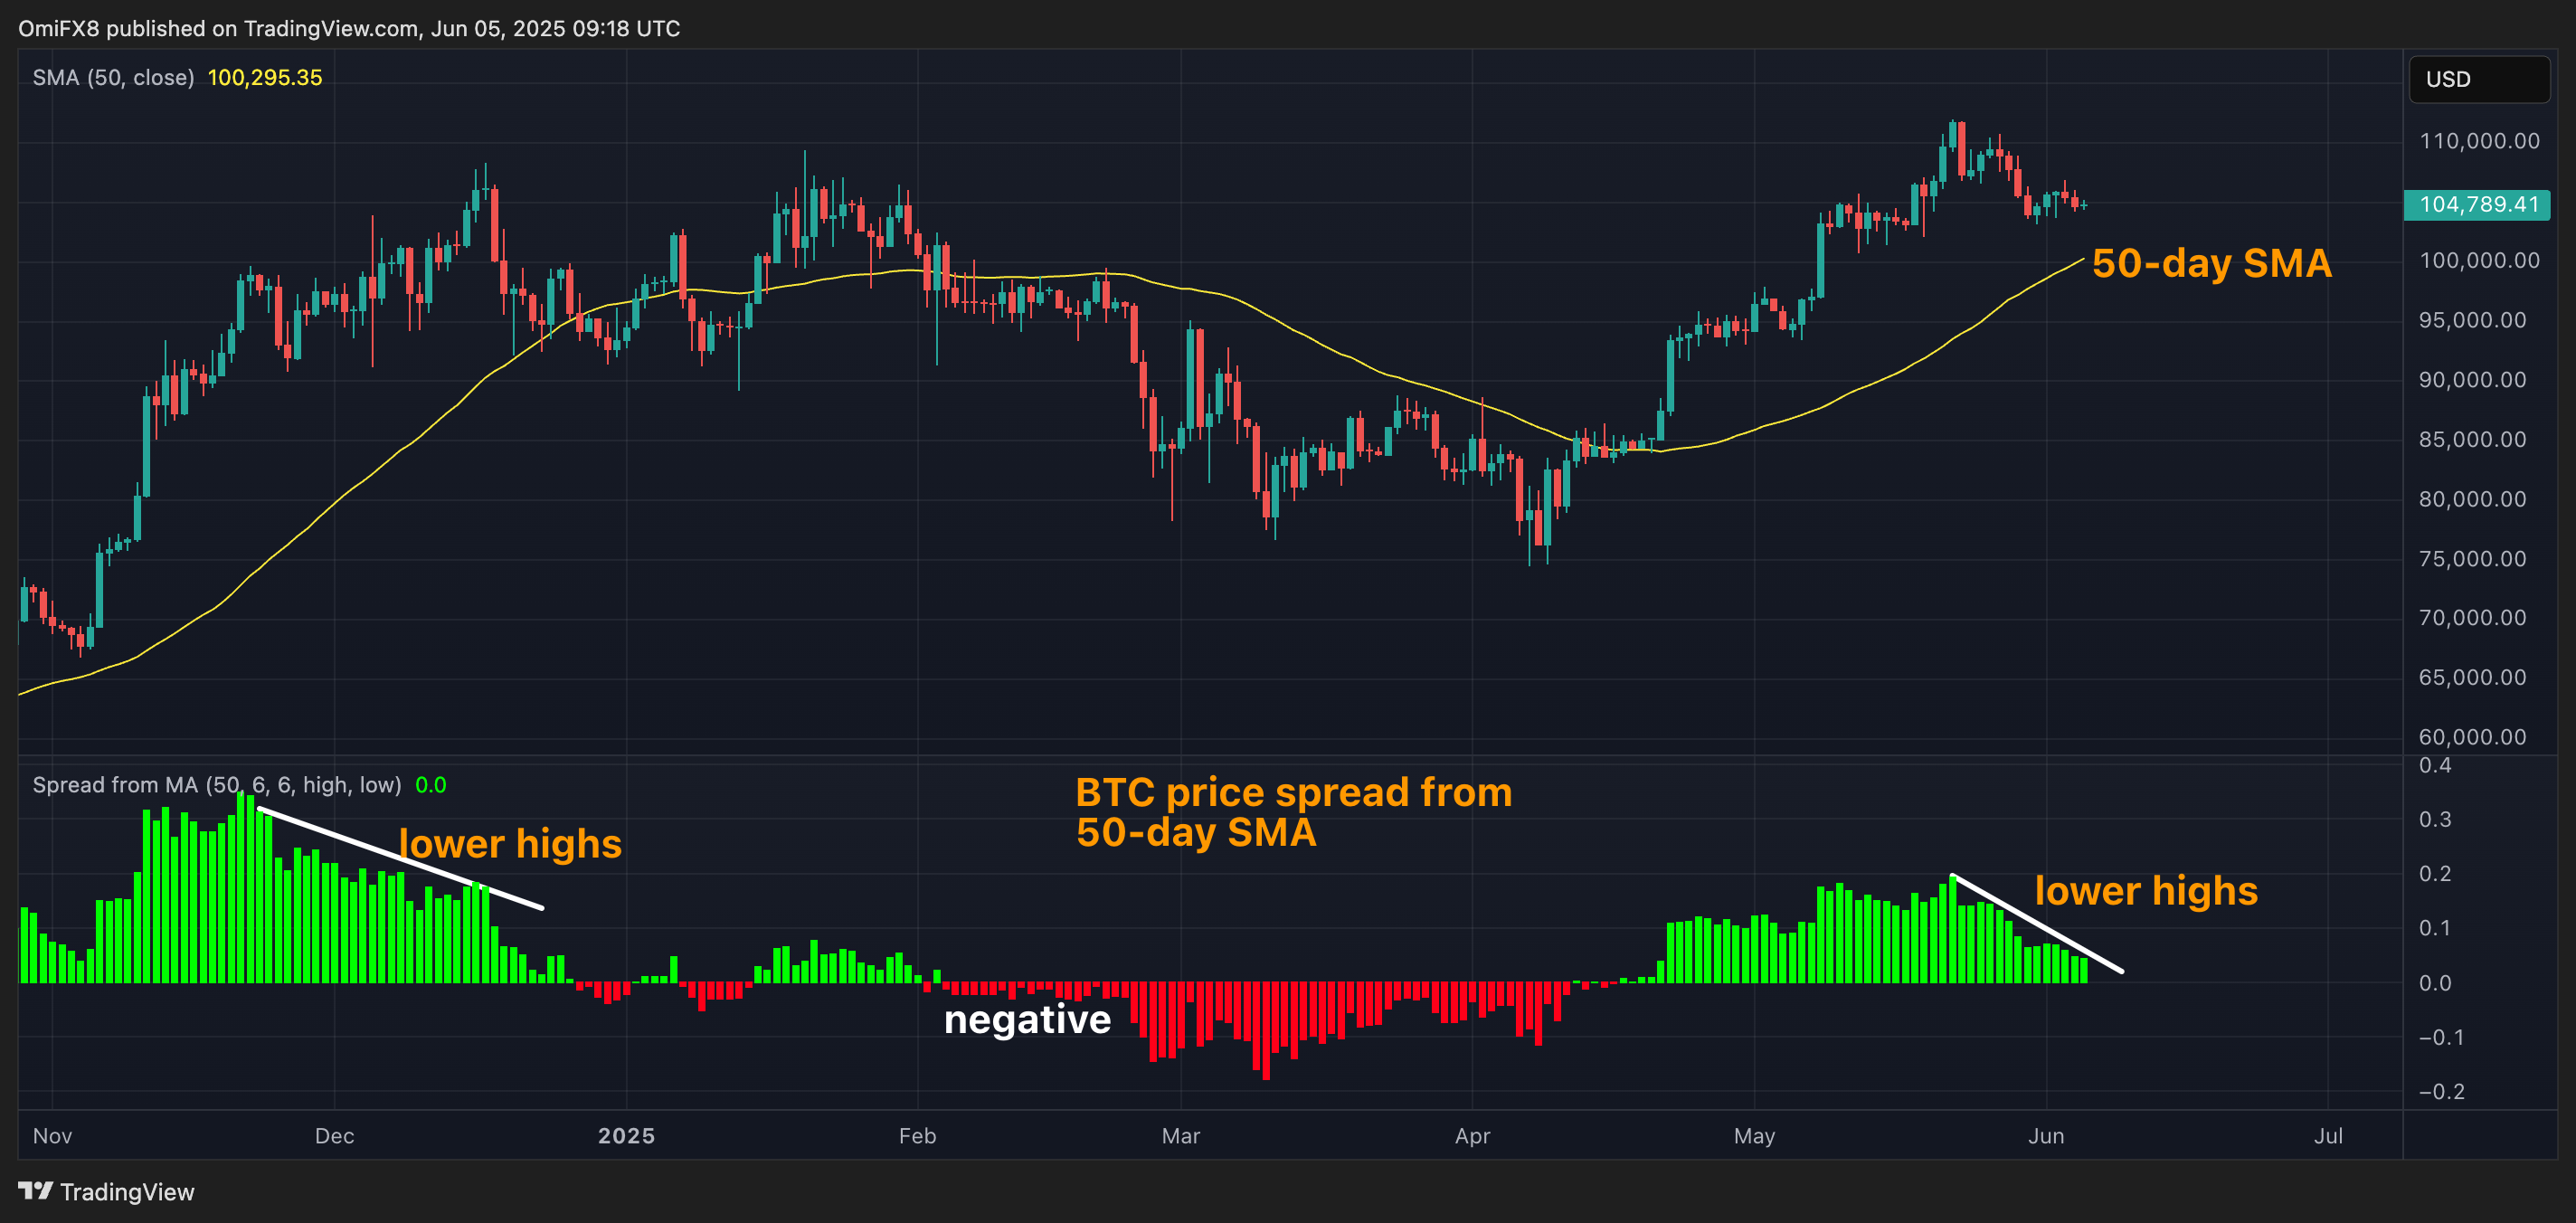
The widely tracked 50-day simple moving average of bitcoin’s BTC price is giving off mixed signals.
The measure hit a record high, climbing into six figures for the first time in a sign of the broader bullish outlook for the leading cryptocurrency by market capitalization. At the same time, however, the spread between the price and the average has narrowed, suggesting scope for a price correction, or drop of at least 10%.
The SMA surpassed the previous peak of around $99,300 recorded on Jan. 31, according to data source TradingView. Analysts track the average as an indicator of market trends and as a potential zone of demand and supply.
The new high for the average comes weeks after the spot price set a lifetime peak of over $111,000 on May 22. The rally was likely led by strong inflows into the spot exchange-traded funds (ETFs) and a broader shift away from U.S. assets.
The gains have stalled since then, with the price retreating to $105,000 and narrowing the gap over the 50-day SMA, indicating waning upside momentum. In other words, buying pressure has weakened, raising the risk of a price pullback.
The caution suggested by the price-to-50-day SMA spread is consistent with the on-chain data showing increased profit taking by holders.

The lower pane on the chart shows the difference between the spot price and the 50-day SMA. Positive and rising values suggest strengthening upward momentum, while negative values suggest the opposite.
The spread, though positive, has been narrowing since May 22, indicating a weakening of the bull momentum. A potential correction could find support of the 50-day SMA at $100,295.
A similar pattern was observed through December, marking uptrend exhaustion above $100,000. The spread eventually flipped negative in February, presaging a multiweek sell-off to $75,000.

