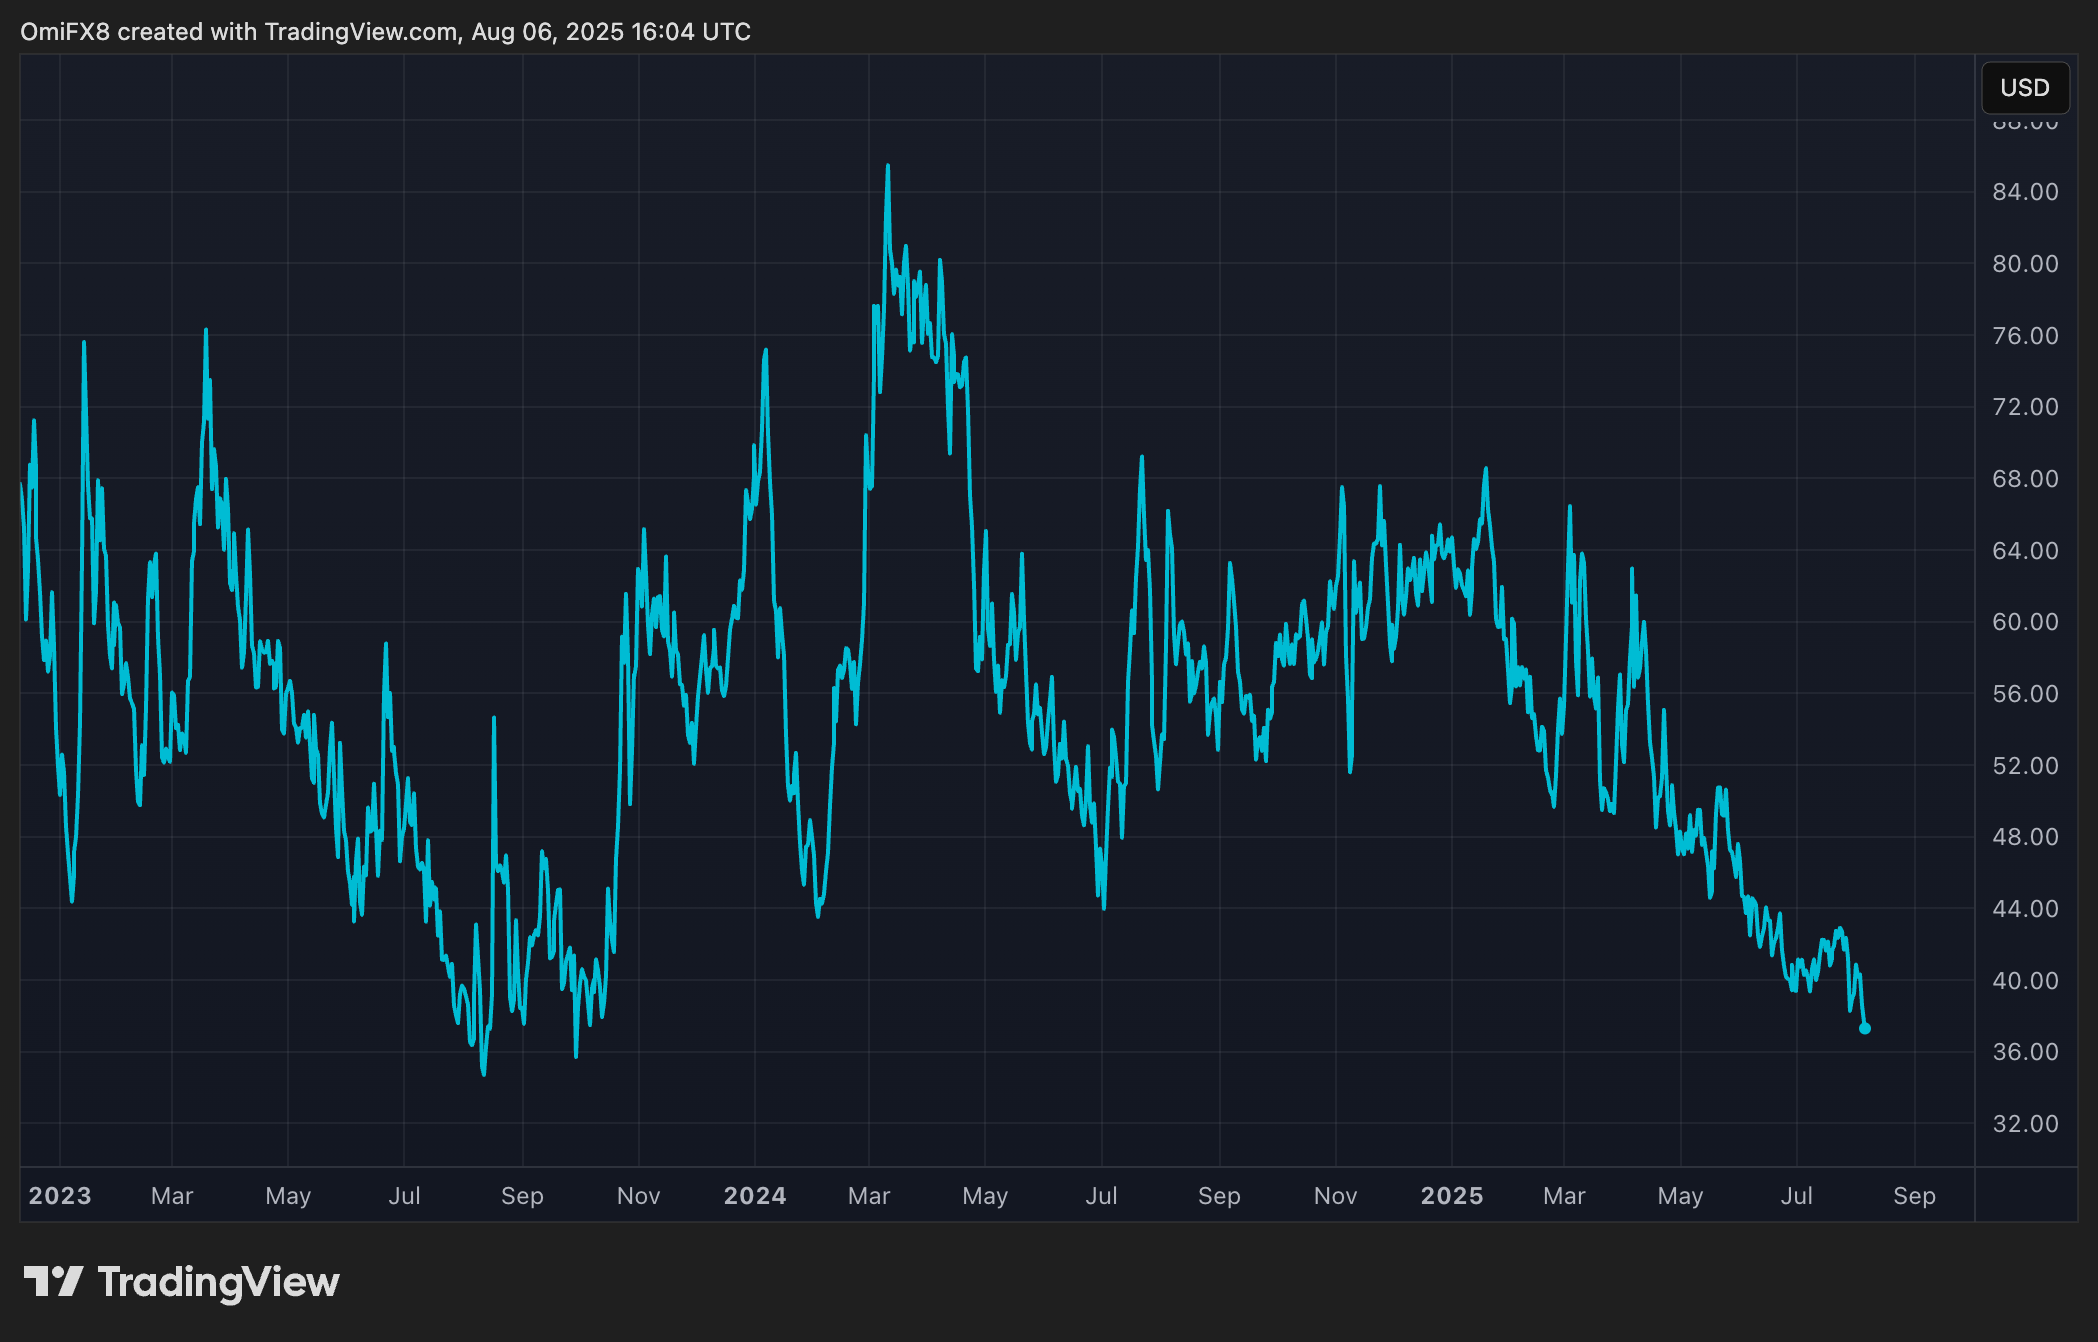
Bitcoin’s (BTC) volatility meltdown continues as the cryptocurrency remains stagnant, with slow price action between $110,000 and $120,000.
The cryptocurrency’s 30-day implied volatility, as represented by Volmex’s BVIV index, fell to an annualized 36.5% late on Wednesday, reaching levels last seen in October 2023, when BTC was trading below $30,000, according to data source TradingView.
The new multi-year low in implied volatility suggests that options traders are not yet rushing for hedges, despite U.S. economic data raising concerns about stagflation. The demand for options, which are contracts used to hedge against or profit from price swings, is a major driver of an asset’s implied volatility.

The same thing can be said about stocks, where the VIX index has reversed Friday’s spike from 17 to 21. The VIX measures the 30-day implied volatility in the S&P 500.
BTC mirrors stock market volatility patterns
BTC’s implied volatility has been in a months-long downtrend, moving in the opposite direction of the cryptocurrency’s price, which has surged from $70,000 to over $110,000 since November.
The negative correlation marks a profound shift in bitcoin’s market dynamics. Historically, BTC’s volatility and its spot price moved in tandem, with volatility rising in both bull and bear markets.
The change in this spot-volatility correlation is attributed, in part, to the growing popularity of structured products that involve the writing (selling) of out-of-the-money call options, analysts told CoinDesk.
This new dynamic suggests that bitcoin is increasingly mirroring patterns on Wall Street, where implied volatility often dwindles during steady bull runs.

