This is a daily analysis of top tokens with CME futures by CoinDesk analyst and Chartered Market Technician Omkar Godbole.
Bitcoin: Golden Ratio Eyed
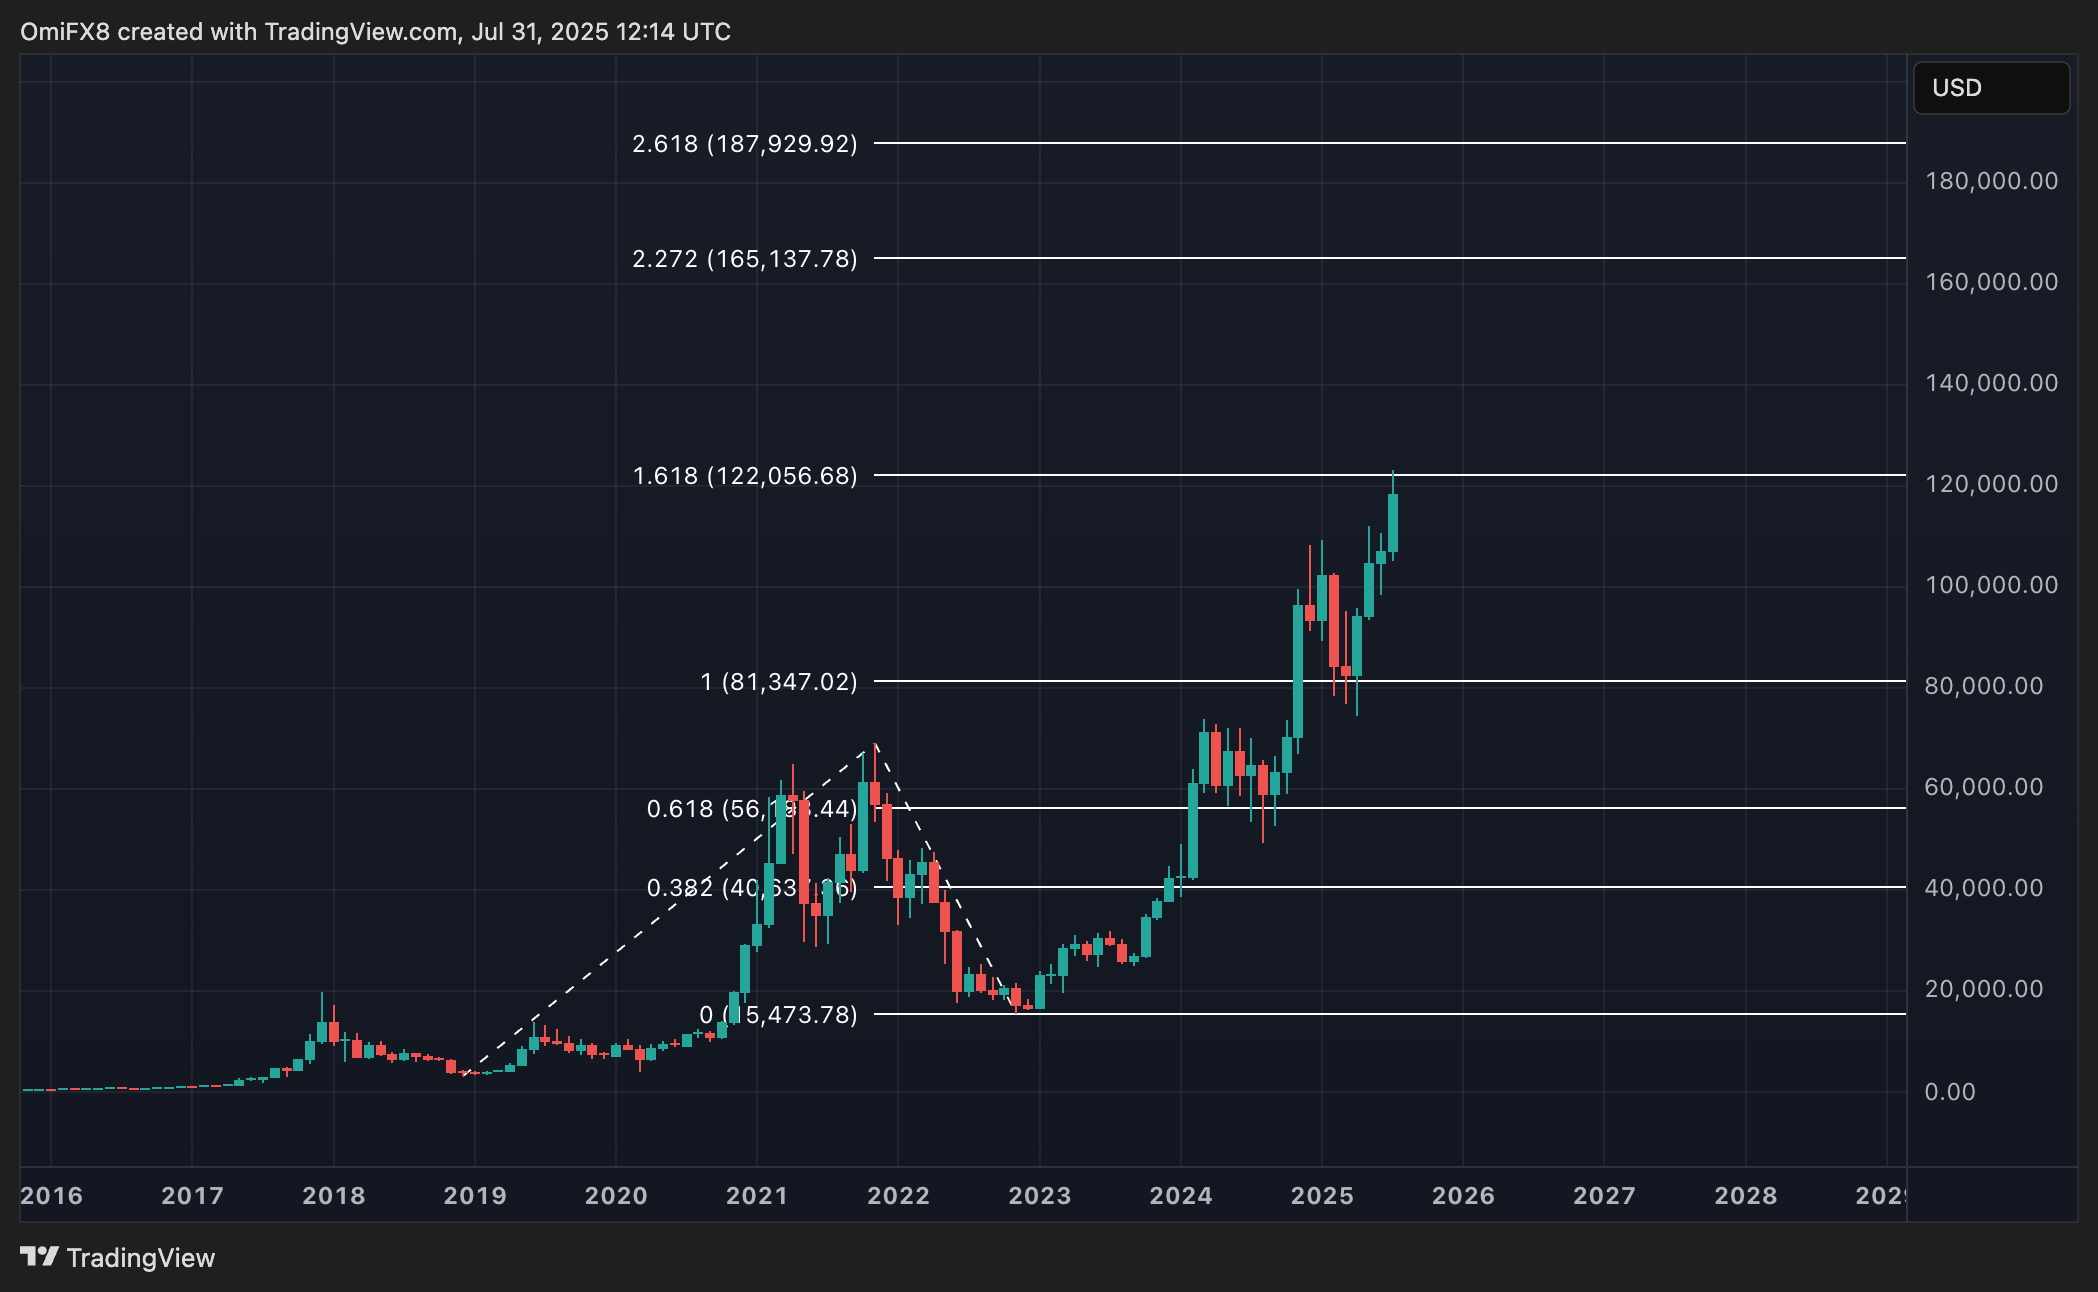
As bitcoin (BTC) continues to trade flat in the $116,000-$120,000 range, the monthly chart shows $122,056 as key resistance that needs to be breached to confirm continuation of the bull run.
That level represents the 1.618% Fibonacci extension, originating from the December 2018 lows, the December 2022 lows, and the 2021 high.
The 1.618% extension is highly important because it’s derived from the “Golden Ratio,” a revered mathematical constant in finance. The level is widely found in nature and art, which is why many believe it also influences human psychology and market movements.
After a market breaks above its previous record high in a strong uptrend, as BTC did in November by moving above $70,000, the 1.618% extension is seen as a powerful target area where bulls tend to take profits and bears initiate new positions.

It is, therefore, no coincidence that momentum appears to have stalled right around $122,056. A firm move above this level would be an indication that buying pressure remains strong enough to absorb profit-taking and bearish resurgence at key levels, shifting the focus to the 2.618% extension at $187,929.
Conversely, continued uptrend exhaustion around the 1.618% level could embolden bears, potentially leading to a top in the bull market.
- Resistance: $120,000, $122,056, $123,181
- Support: $116,000, $114,700, $111,965.
XRP: Focus on 38.2% Fib retracement
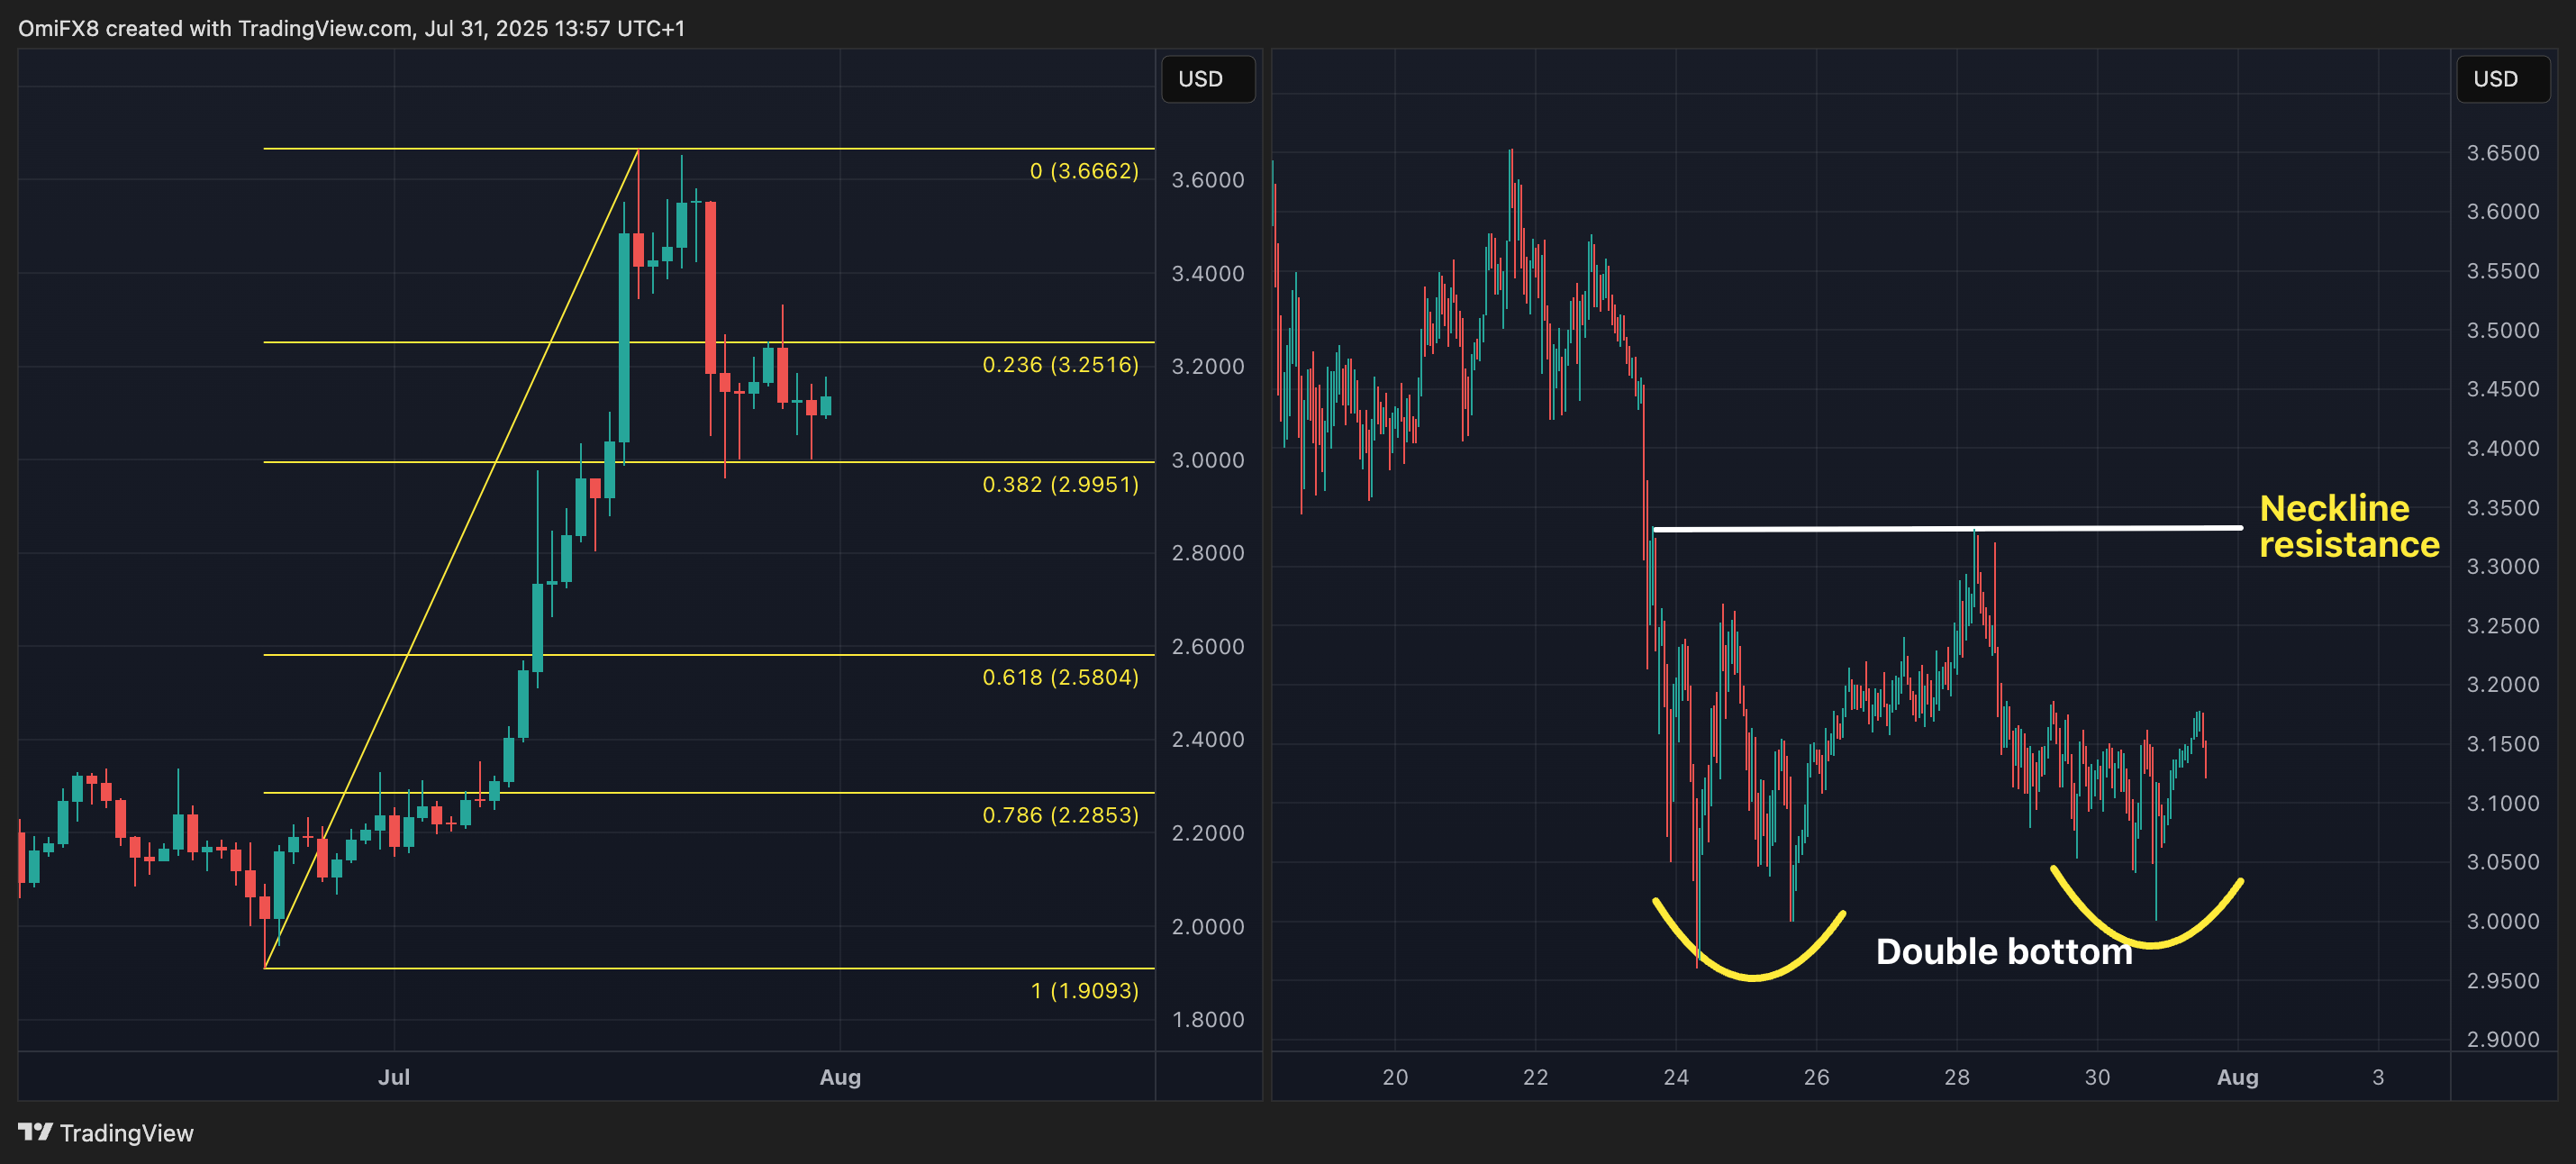
Since last Thursday, the pullback in the payments-focused cryptocurrency XRP (XRP) has stalled, with bears repeatedly failing to establish a foothold below $2.995, the 38.2% Fibonacci retracement of the June-July rally. The price action, when viewed on the hourly chart, suggests a double bottom formation at $2.995, with the neckline resistance at $3.33 (the July 28 high).

A move above $3.33 would confirm the breakout and open the door to a retest of the recent high of $3.65. That said, as of the time of writing, the negative daily chart MACD and downward-sloping hourly chart averages suggest otherwise. Traders, therefore, need to keep an eye out for a move below $2.995, which will likely yield a deeper decline.
- Resistance: $3,33, $3.65, $4.00
- Support: $2.995, $2.65, $2.58
Ether: MACD flips bearish
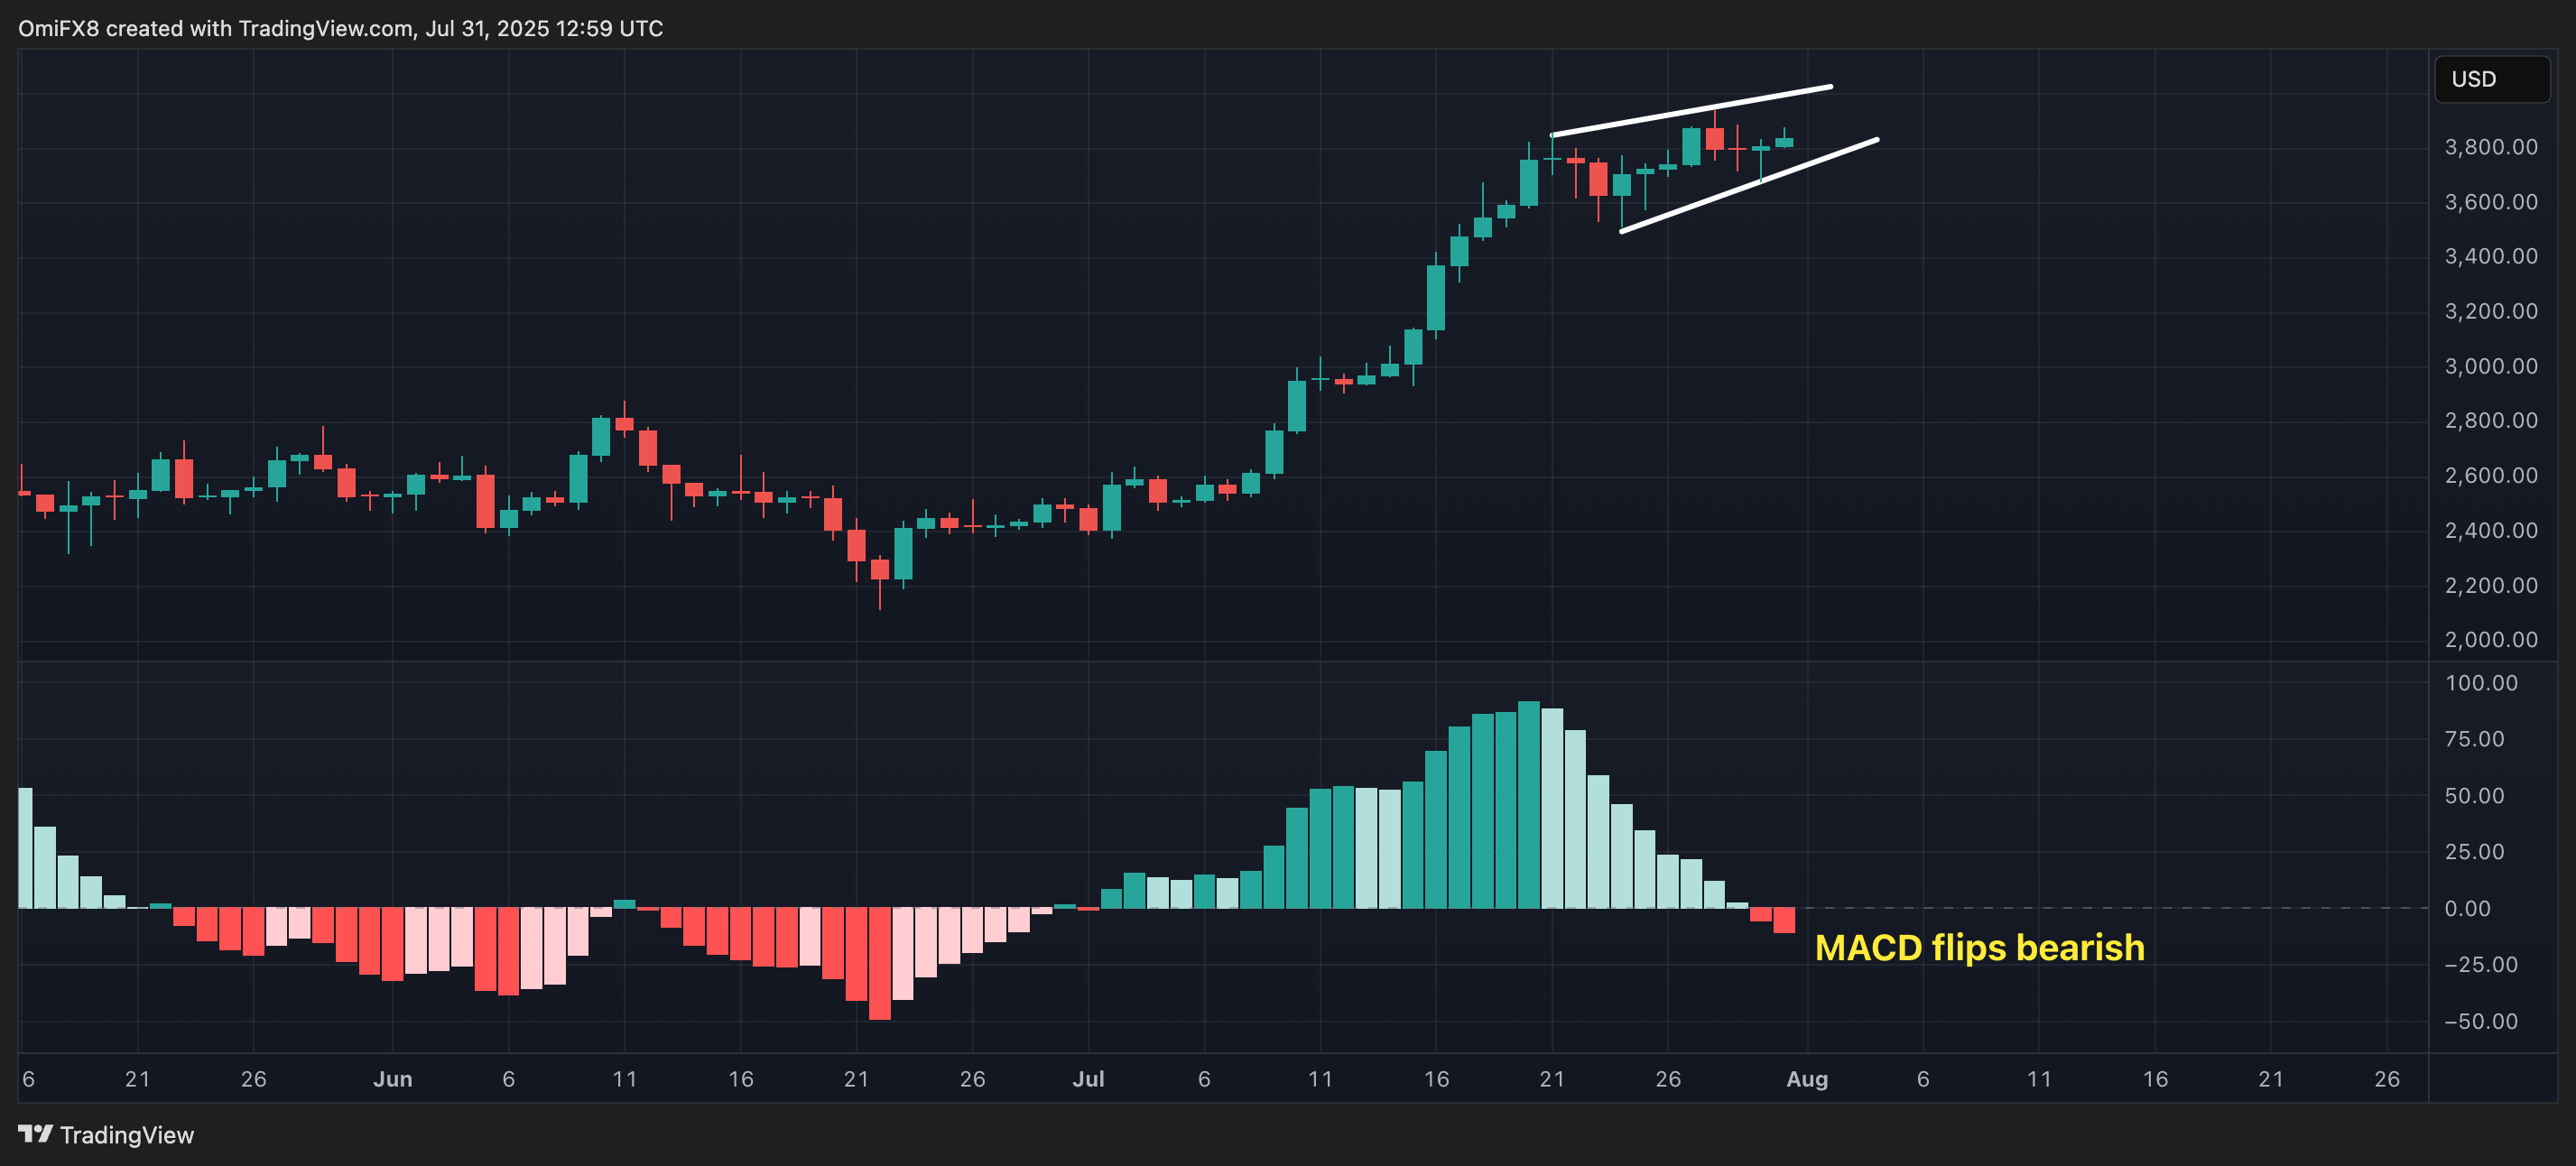
Ether is trading indecisively in a wedge-like pattern marked by converging trendlines. However, prospects of a notable pullback are improving, as the daily chart MACD histogram, a trend-following indicator, has flipped negative. The 50-, 100-, and 200-hour SMAs are now flat-lined, indicating a loss of upward momentum. A move below the July 25 low of $3,510 would imply a short-term trend reversal, shifting the focus to $3,000. On the higher side, a FOMO rally may unfold once the $4,000-$4,100 range – the strong resistance zone from 2024 – is crossed.

- Resistance: $3,941 (the July 28 high), $4,000, $4100.
- Support: $3,510, $3,000, $2,879.
Solana: Rising channel at risk
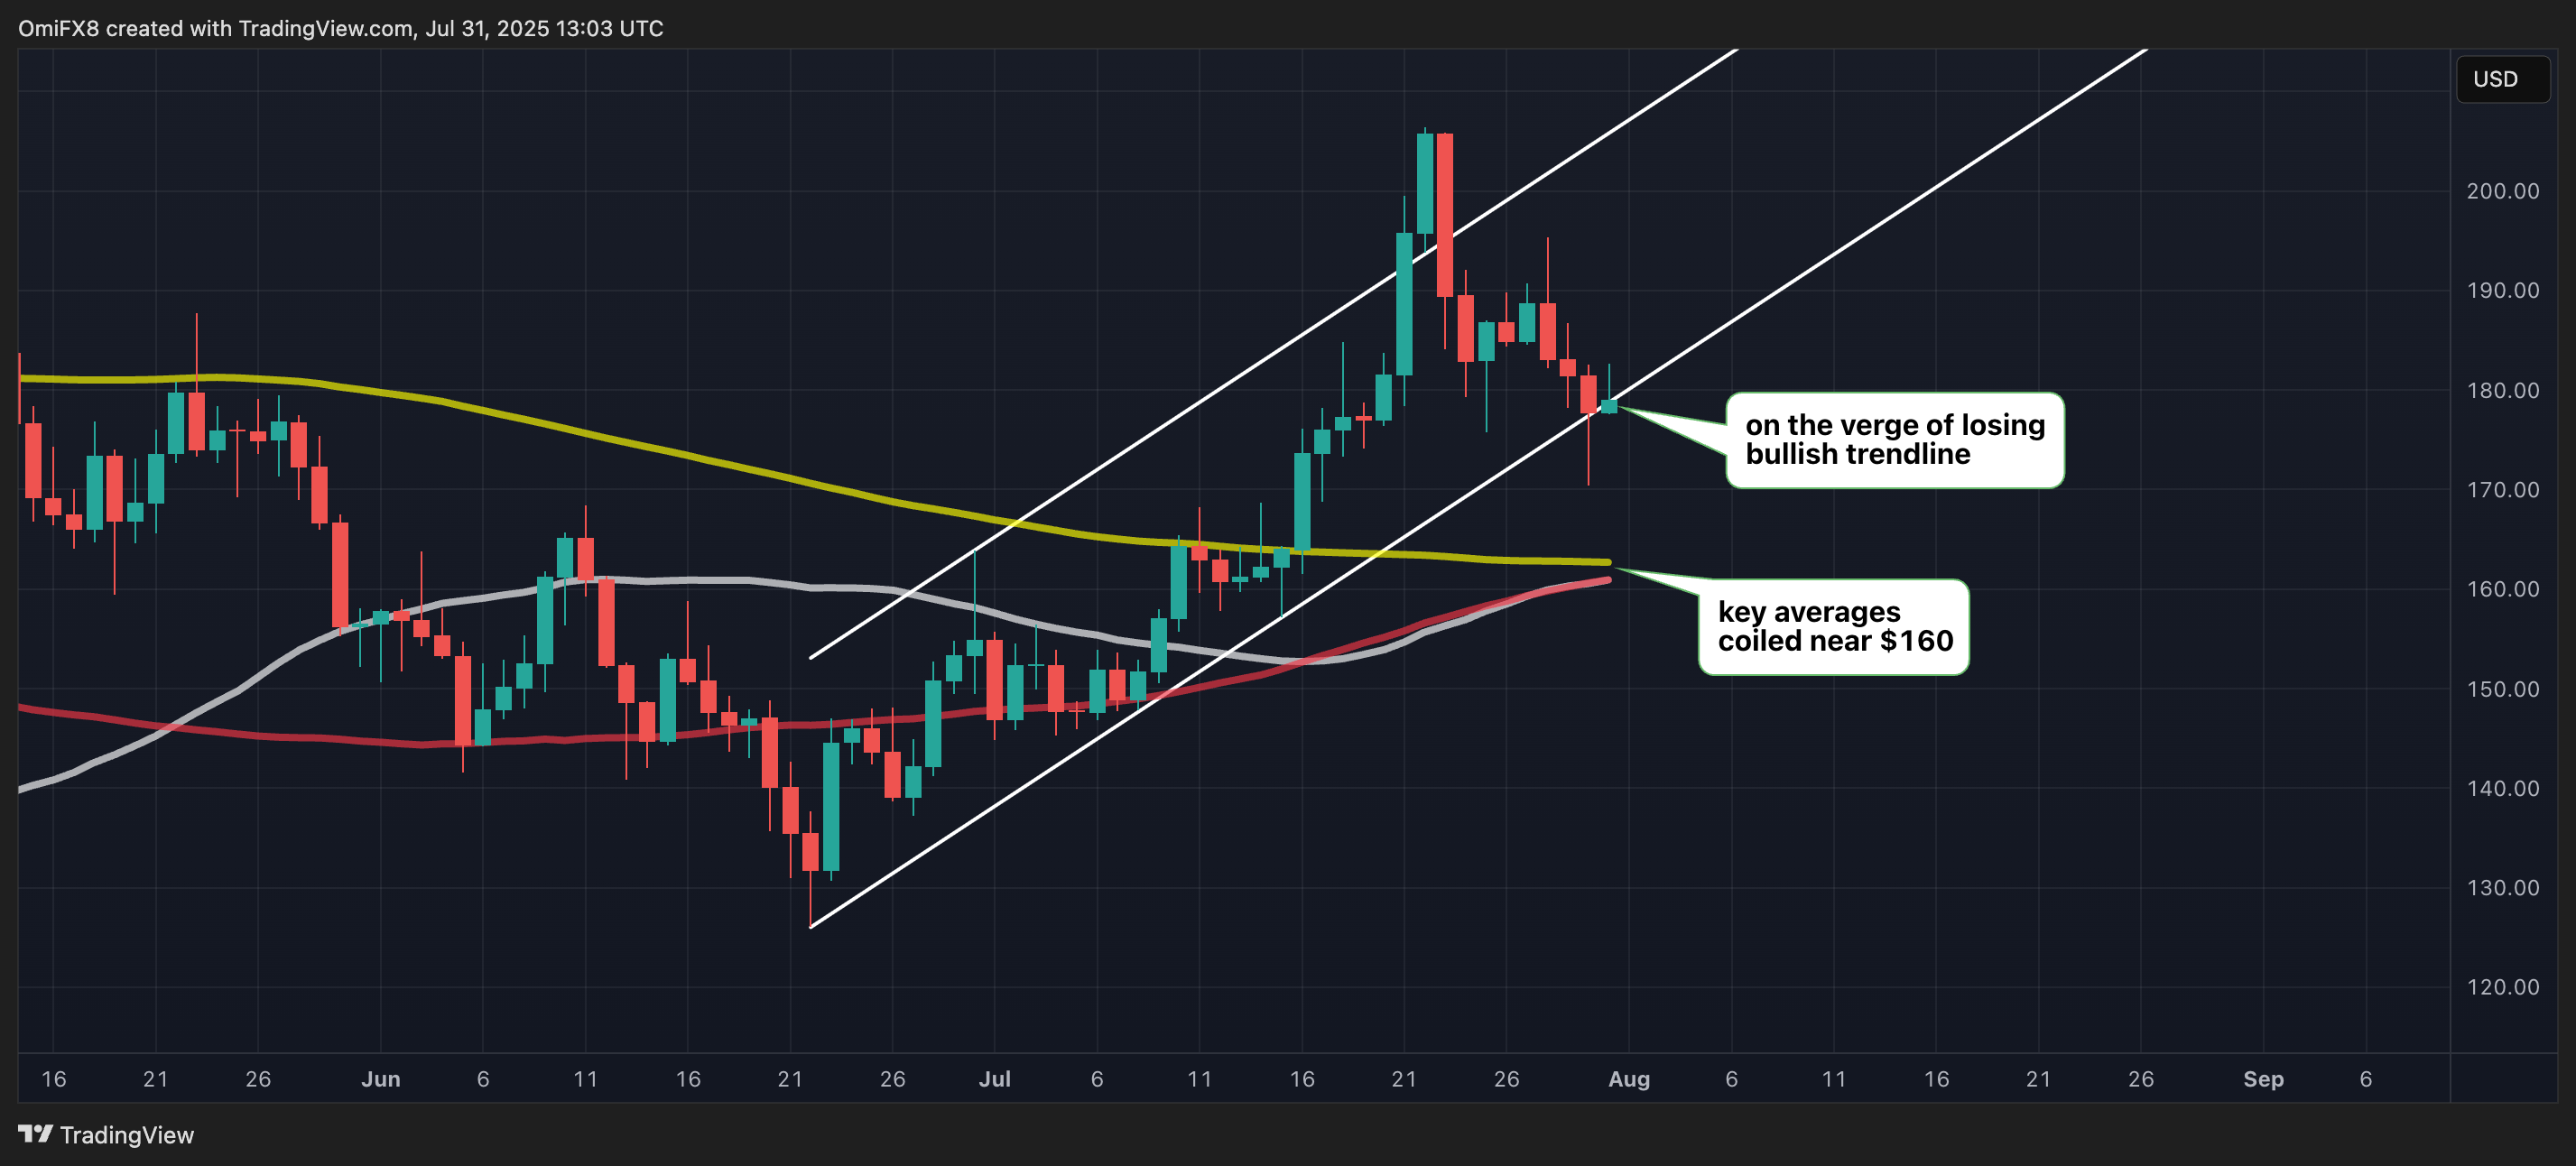
SOL’s price is at risk of diving out of the bullish trendline drawn from higher lows established since June 22. Such a move would confirm a bearish shift in trend, potentially leading to a test of the 50-, 100-, and 200-day SMAs, which are coiled at around $160-$162. The lower high of $195 established on July 28 is the level to beat for the bulls.

- Resistance: $195, $206, 218.
- Support: $160-$162, $156 (the 61.8% Fib retracement of June-July rally), $126.

