

A bullish technical analysis pattern, contrasting with the one in bitcoin (BTC) that warned of a recent market swoon, is seemingly emerging on bitcoin-holder MicroStrategy’s (MSTR) price chart.
The MicroStrategy pattern, a double bottom, comprises two consecutive troughs at about the same price, said to reflect downtrend exhaustion, and a trendline (a so-called neckline) drawn through the high point between them. A move beyond the trendline confirms the breakout, or the bearish-to-bullish trend change.
That’s especially true when the pattern unfolds after a notable slide, as in MSTR’s case, and the gap between troughs and the high is at least 10%, according to technical analysis theory. In MSTR’s case, it’s greater than 35%.
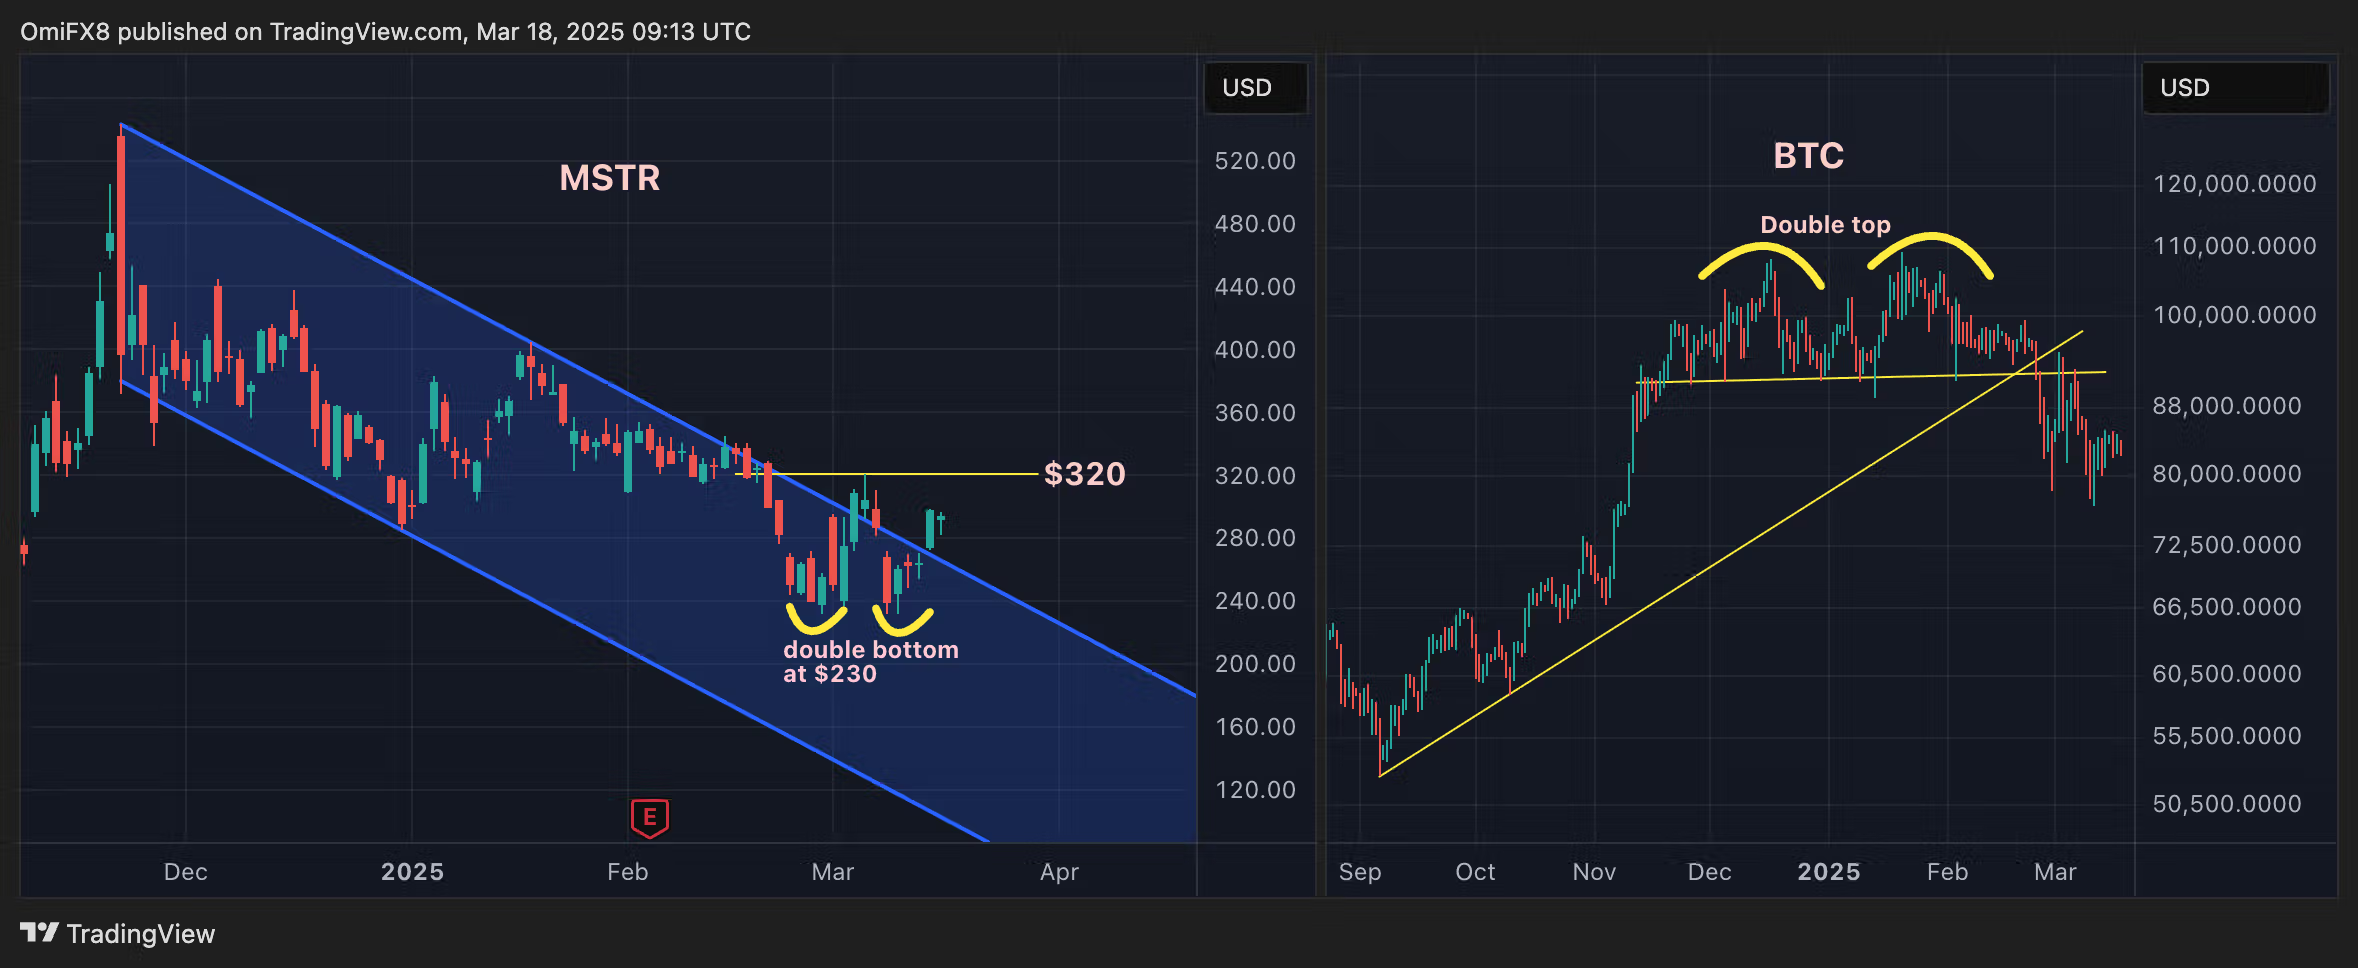
The chart shows a double bottom in MSTR at around $230 since late February with the neckline resistance identified by the early March recovery to $320.94.
A price move through that resistance would confirm the double-bottom breakout and signal a renewed bull run. Technical analysts typically add the gap between troughs and the neckline to the breakout point to derive the potential upside move, which, in this case, means a rally to $410.
The share price has also broken through the downtrend line, characterizing the meltdown from the November high of $543.
The evolving double bottom on the MSTR price chart looks like a mirror image of BTC’s double top. That pattern from early this year that warned of a price sell-off to $75,000.
BTC’s double top breakdown happened on Feb. 24, with prices falling below $91,000, suggesting a bearish trend reversal. The decline gathered pace in the following days, with prices sliding to as low as $76,800 last week. Wall Street’s tech-heavy index, Nasdaq, saw a similar breakdown early this month.
Double bottoms and double tops both have low failure rates, according to CMT books, meaning breakouts and breakdowns usually lead to extended price rallies or sell-offs.
MicroStrategy is the world’s largest publicly listed bitcoin holder, boasting a coin stash of 499,096 BTC ($41.5 billion).