Bitcoin (BTC) reached new all-time highs just above $112,000 on Wednesday, although the increase was only marginal compared to the previous peak. Despite the wave of bullish corporate adoption, with public companies adding bitcoin to their balance sheets.
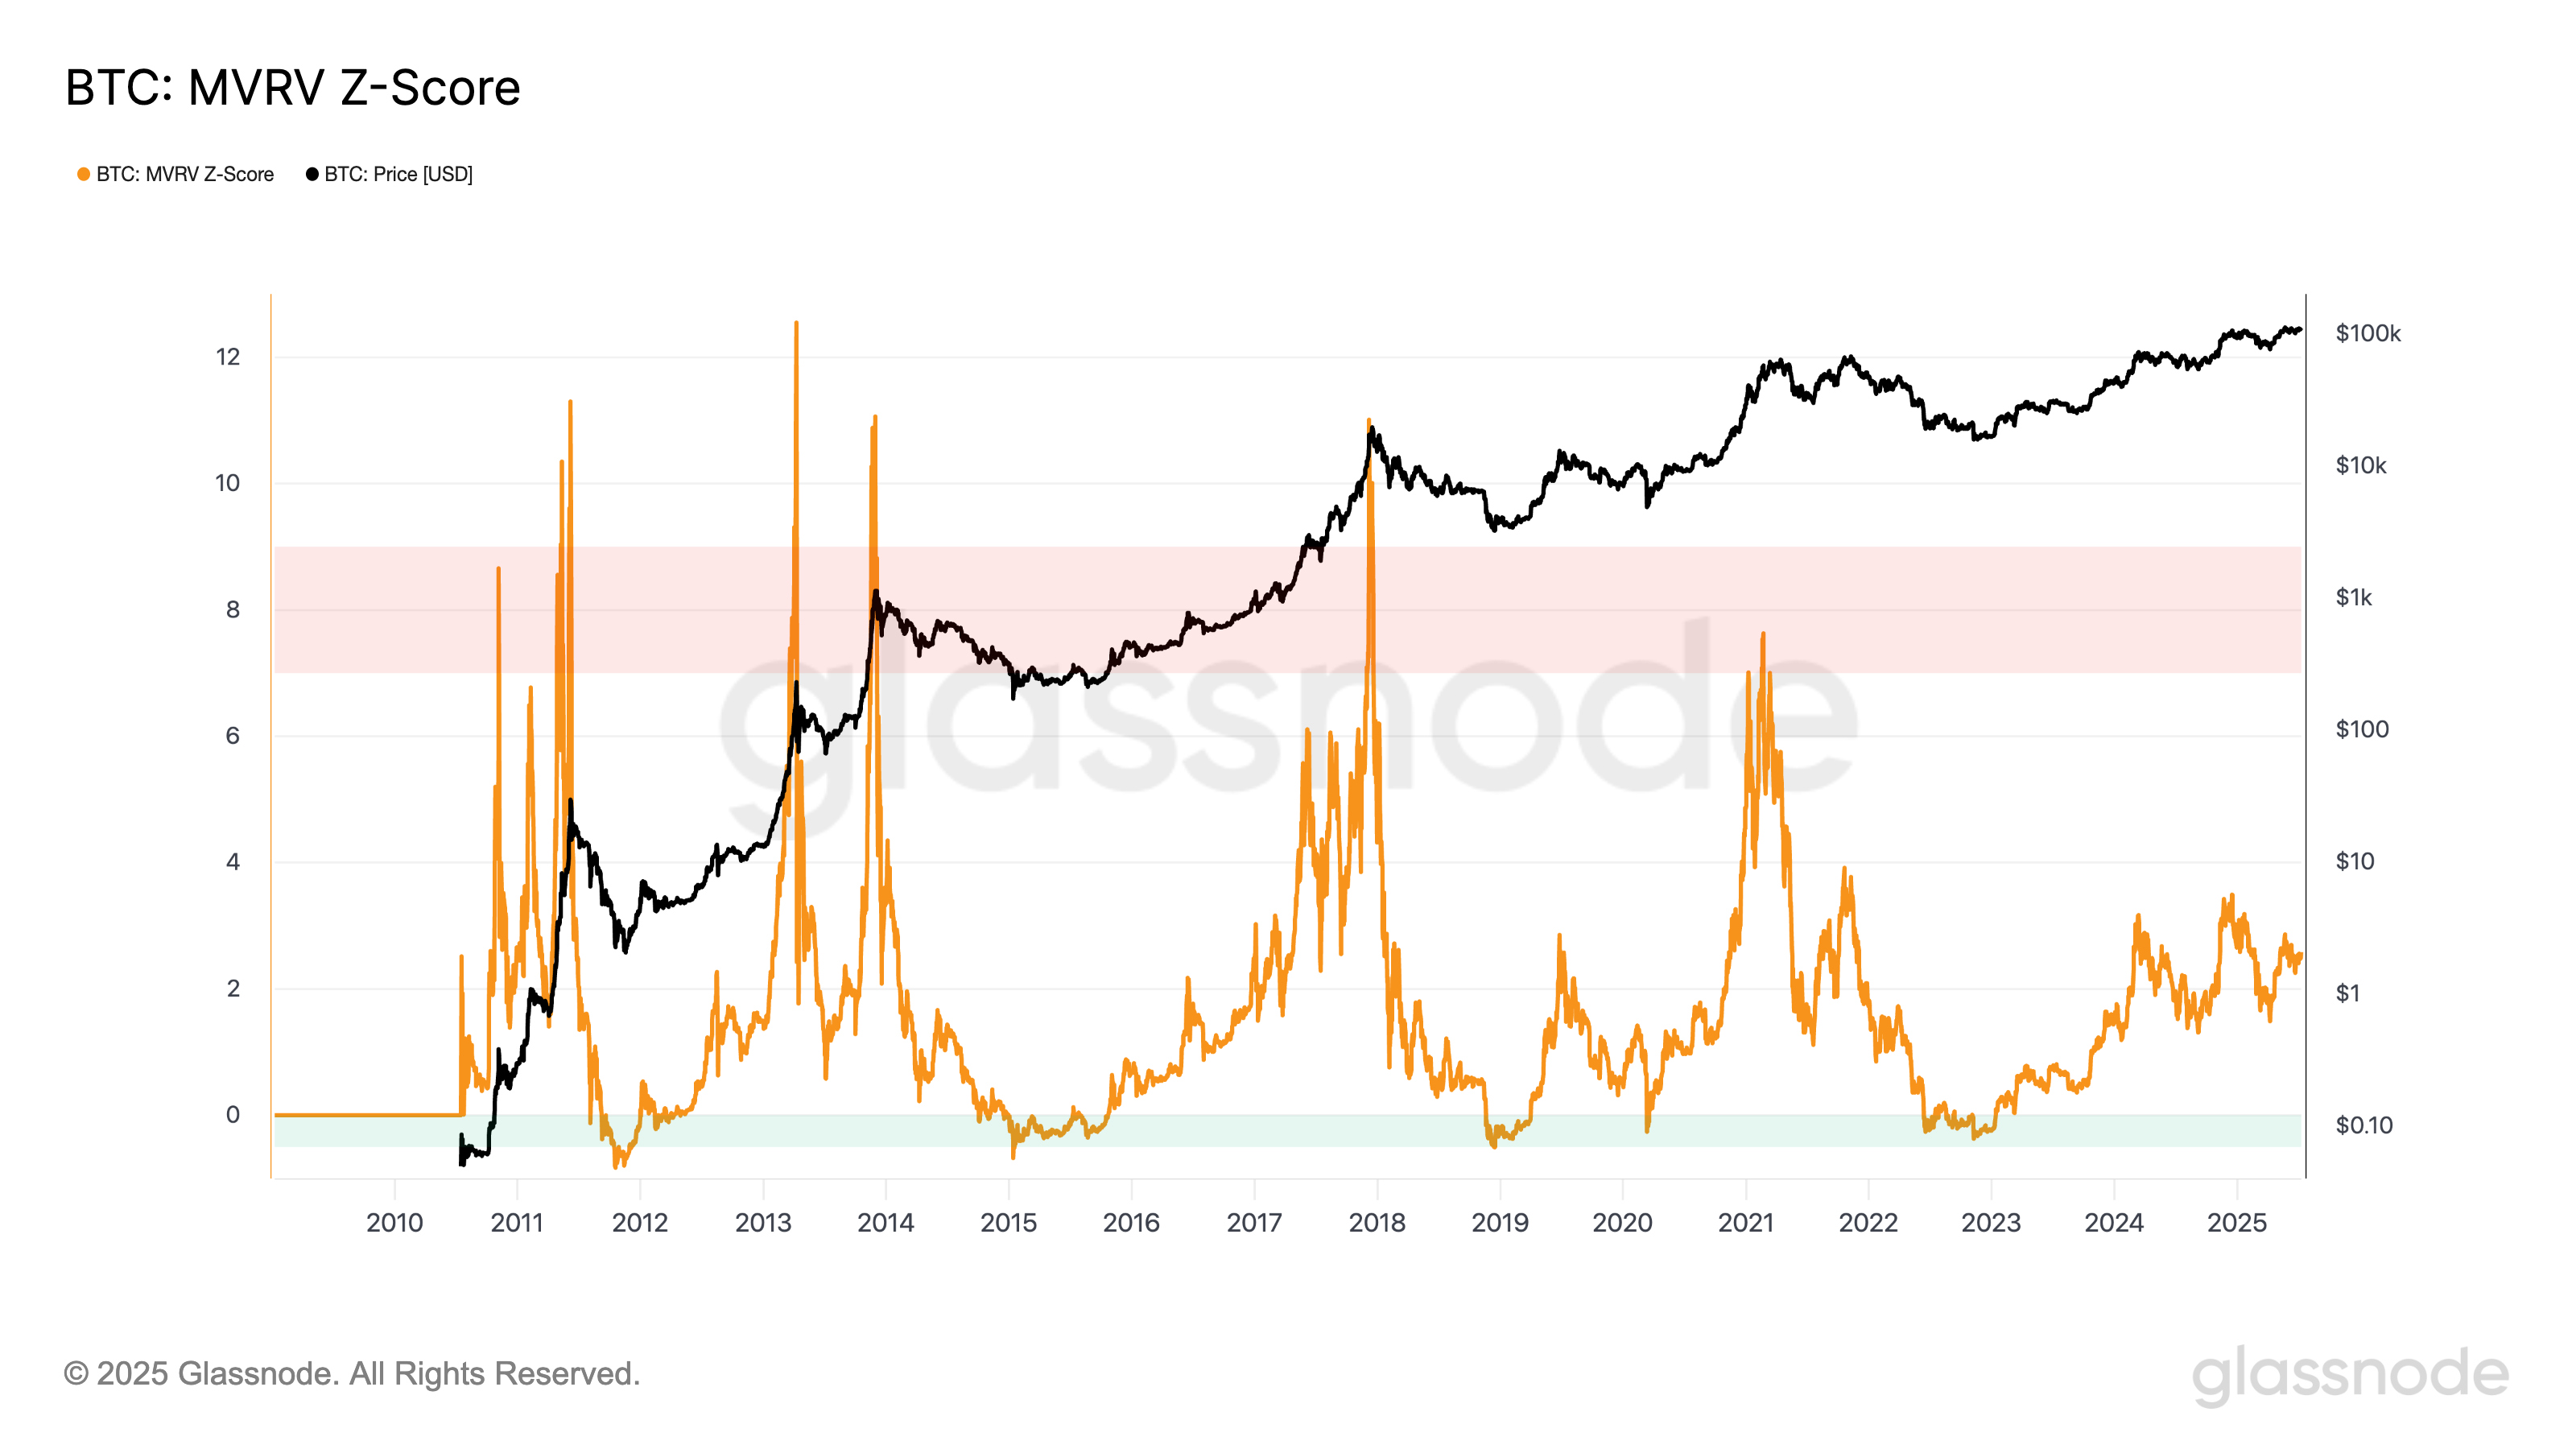
On-chain data suggests that bitcoin has more room to run when compared to previous cycle highs. One useful metric in this analysis is the MVRV Z-Score, which helps evaluate whether bitcoin is overvalued or undervalued relative to what could be considered its fair value.
Unlike a traditional z-score, the MVRV Z-Score uniquely compares the market value to the realized value. When the market value, calculated as the network’s valuation based on the spot price multiplied by supply, sits significantly above the realized value, which reflects the cumulative capital inflow into the asset, this has historically signaled market tops [red zone]. Conversely, when the market value is well below the realized value, it has often indicated market bottoms [green zone].
The MVRV Z-Score is defined as the ratio between the difference of market cap and realized cap, and the standard deviation of market cap, expressed as [market cap minus realized cap] divided by the standard deviation of market cap. The standard deviation is calculated cumulatively from the first available data point to the present day, making it a long-term measure.
Currently, the MVRV Z-Score sits at 2.4. In past bear market lows, bitcoin has registered scores below zero, as seen in 2015, 2019, and 2022. Meanwhile, cycle tops have historically occurred when the score reaches 7 or higher, as was the case in 2017 and 2021, according to Glassnode data.
Although this is just one data point, it indicates that bitcoin still has significant potential for further upside compared to previous cycles.

Read more: This Chart Points to a 30% Bitcoin Price Boom Ahead: Technical Analysis

